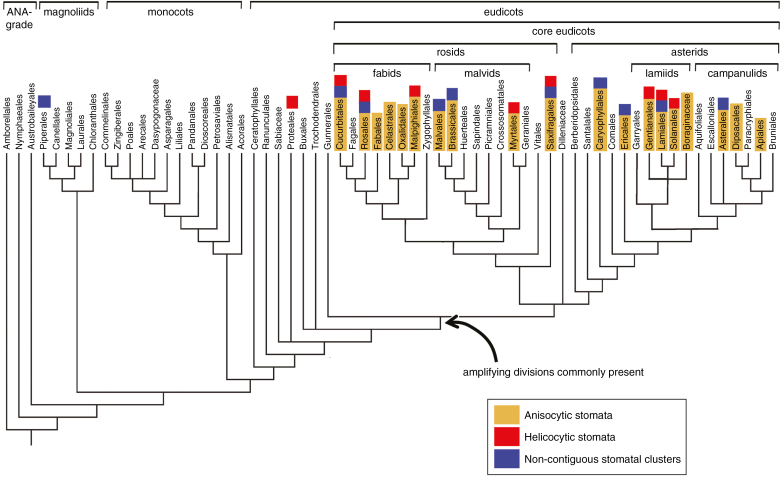
Fig. 6.
Angiosperm tree diagram of order-level relationships adapted from APG III (2009), with superimposed distributions of three stomatal traits: anisocytic stomata (yellow), helicocytic stomata (red) and non-contiguous stomatal clusters (blue). Stomatal data from literature summarized by Metcalfe and Chalk (1979); data on non-contiguous stomatal clusters from Metcalfe and Chalk (1979) and Gan et al. (2010).

