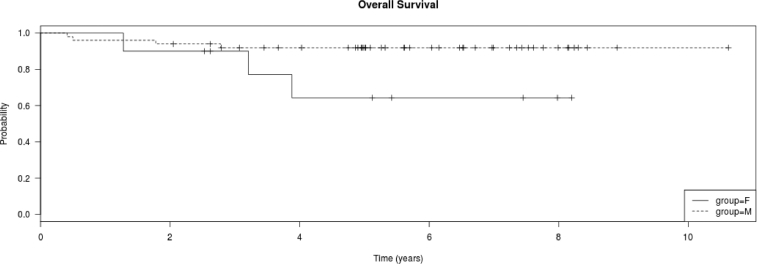
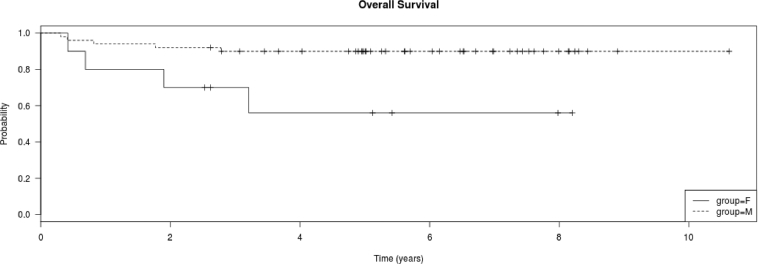
Fig. 2.
a. Kaplan Meier plot of overall survival of all treated patients, CNS3 vs. non-CNS3. CNS3 patients had shorter 5-year survival than non-CNS3 patients (non-CNS3 93.2% [2.6%] vs. CNS3 73.3% [9.1%]; log rank test P = 0.045). b. Kaplan Meier plot of disease free survival of all treated patients, CNS3 vs. non-CNS3. CNS3 patients had shorter 5-year survival than non-CNS3 patients (non-CNS3 90.9% [SE 3.1%] vs. CNS3 66.7% [SE 10.4%]); log rank test P = 0.0163). c. Kaplan Meier plot of overall survival of the 60 treated patients by gender. Females had shorter 5-year survival than males (F 64.3% [SE 17%] vs. M 91.9% [SE 3.4%]); log rank test P = 0.043). d. Kaplan Meier plot of disease free survival of the 60 treated patients by gender. Females had shorter 5-year survival than males (F 56% [SE 17%] vs. M 90% [SE 4.3%]); log rank test P = 0.0108).


