Figure 1.
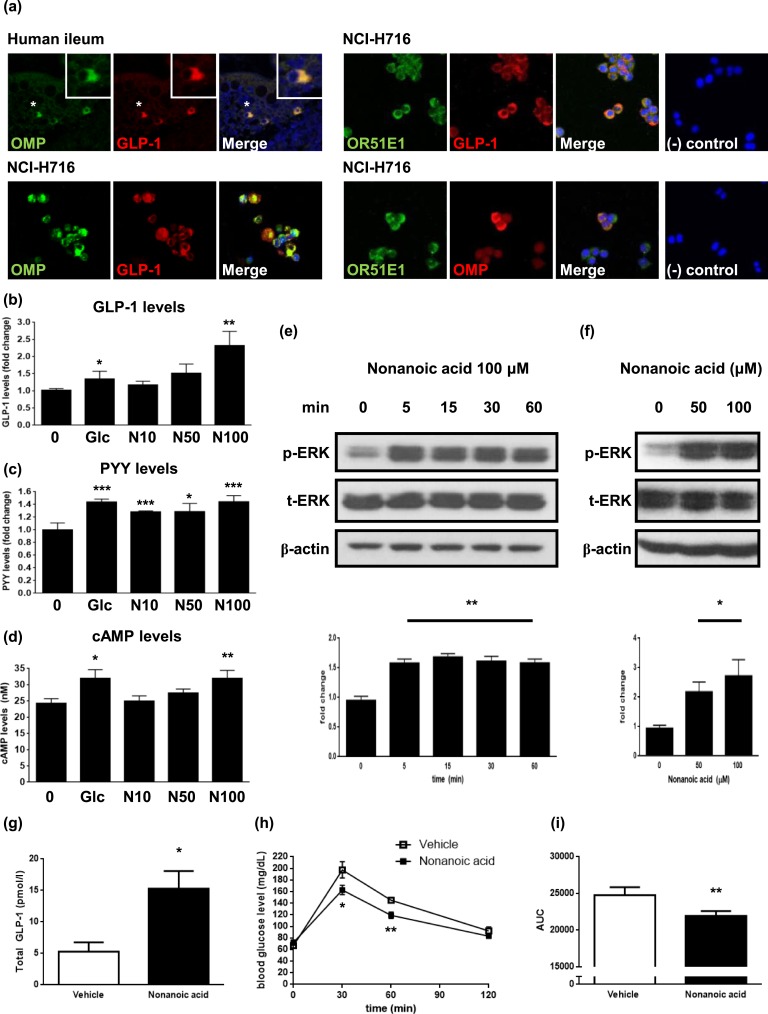
Nonanoic acid stimulates GLP-1 secretion in OR51E1-expressing enteroendocrine L cells. (a) Expression of OMP in GLP-1-secreting L cells in the human ileum section (upper, left) and NCI-H716 cells (lower, left). Boxed areas represent higher magnification of selected cells (indicated with asterisks). Representative images showing colocalization of OMP, OR51E1, and GLP-1 in NCI-H716 cells (right). Negative controls showed no immunostaining in NCI-H716 cells. Images of human ileum were obtained with a laser-scanning microscope at magnification of ×200 and NCH-H716 cells at magnification of ×400. (b) NCI-H716 cells were incubated with different concentrations of nonanoic acid or 50 mM glucose for 2 h, and media were collected for analysis of secreted GLP-1 levels. The data in the column are obtained from mean fold change value ± SD of six independent experiments. (c) NCI-H716 cells were incubated with different concentrations of nonanoic acid or 50 mM glucose for 2 h, and media were collected for analysis of secreted PYY levels. The data in the column are obtained from mean fold change value ± SD of three independent experiments. (d) NCI-H716 cells were incubated with different concentrations of nonanoic acid or 50 mM glucose for 30 min, and intracellular cAMP levels were assessed. (e) NCI-H716 cells were treated with 100 µM of nonanoic acid for indicated periods of time. Bands are representative of three independent experiments, and data in the column are obtained from mean relative density ratios ± SD of normalized values by densitometry. (f) NCI-H716 cells were treated with different concentrations of nonanoic acid for 15 min. Bands are representative of three independent experiments, and data in the column are obtained from mean relative density ratios ± SD of normalized values by densitometry. (g) Nonanoic acid (500 mg/kg; n = 5) or vehicle (saline; n = 4) was orally administered to rats, and blood samples were drawn 15 min after oral administration and analyzed for total GLP-1 concentrations. (h) Nonanoic acid (500 mg/kg; ▪) or vehicle (□) were orally administered to rats (n = 8 per each group), 30 min before OGTT. Plasma glucose levels were measured at 0 (baseline), 30, 60, and 120 min after glucose administration. (i) AUC was calculated from time 0 to 120 min of OGTT graph. (b)–(f) *P < 0.05, **P < 0.01, ***P < 0.001 vs control; (g)–(i) *P < 0.05, **P < 0.001 vs vehicle. 0, control; Glc, glucose 50 mM; N10, N50, and N100, 10 μM , 50 μM, and 100 μM nonanoic acid, respectively. AUC, area under the curve.

