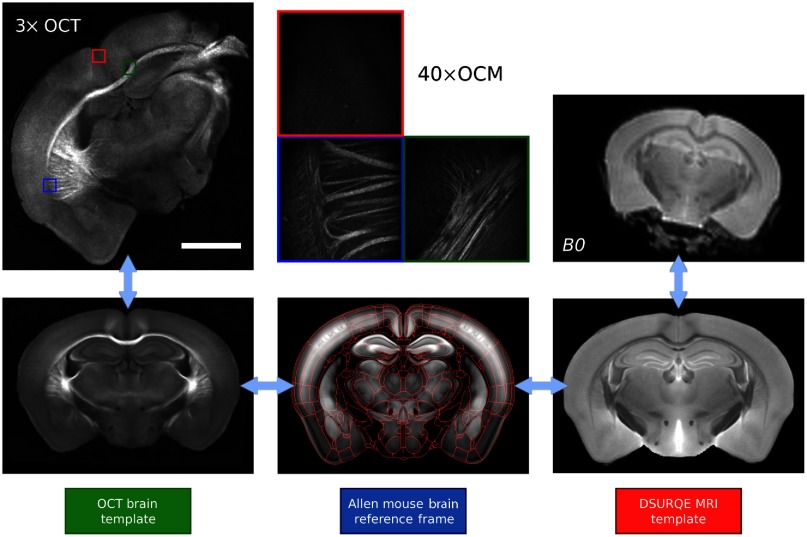
Fig. 3.
Multimodal and multiresolution coregistration workflow. In this illustration, all templates are shown at a resolution of , the OCT slice is at a resolution of , the OCM images are at a resolution of and the dMRI map is shown at a resolution of . The red lines shown in the Allen mouse brain template represent the brain structure boundaries as obtained from the Allen mouse brain atlas.

