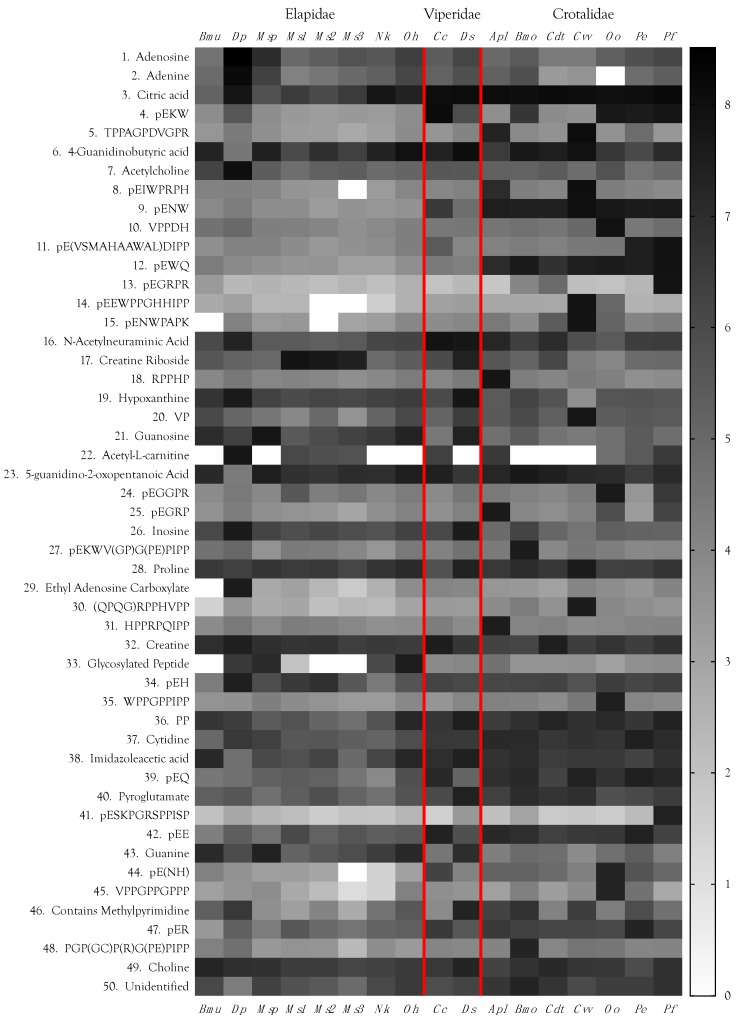
Figure 2.
Heat map of the 50 most abundant metabolites and peptides found in 17 snake venoms, arranged in decreasing order of the maximum concentrations found among the species examined. Compound abundances represent the log10 of peak intensities of positive and negative ions combined, after subtraction of respective baselines. Logarithmic representations have the effect of compressing apparent differences, so these venoms are compositionally much more divergent than can be shown graphically. Taxonomic names: Bmu, Bungarus multicinctus; Dp, Dendroaspis polylepis; Msp, Micrurus spixii; Ms1–3, Micrurus surinamensis, 3 individuals; Nk, Naja kaouthia; Oh, Ophiophagus hannah; Cc, Cerastes cerastes; Ds, Daboia siamensis; Apl, Agkistrodon piscivorus leucostoma; Bmo, Bothrops moojeni; Cdt, Crotalus durissus terrificus; Cvv, Crotalus viridis viridis; Oo, Ovophis okinavensis; Pe, Protobothrops elegans; Pf, Protobothrops flavoviridis.

