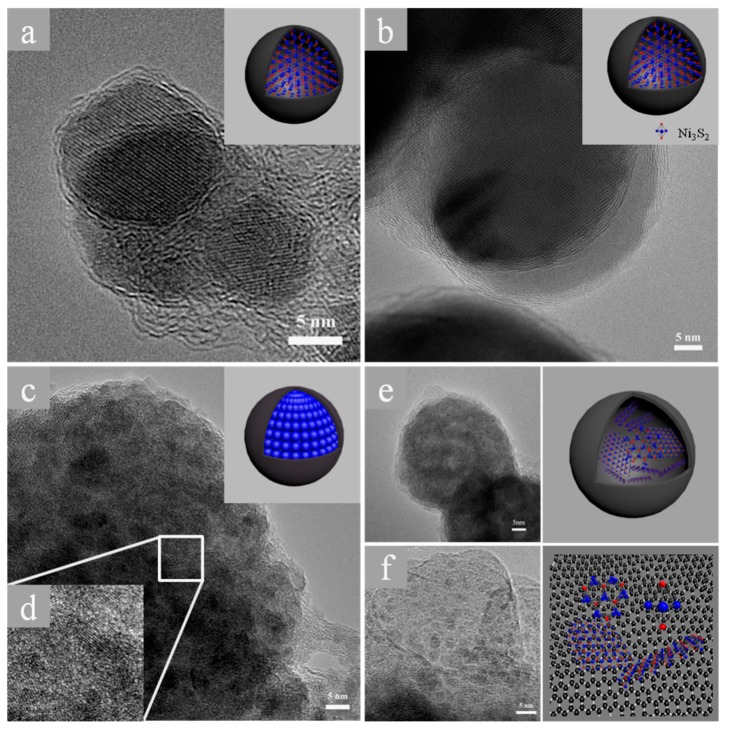
Figure 6.
The diagrammatic of the nanocomposites during the Li+ insertion/extraction and their TEM images. (a) the TEM image of composite material without any cycling process; (b) the electrode material after 2 cyclings; (c) the TEM image after 20 cycles; (d) the HTEM image of image (c); (e,f) the different morphology after 60 cycles and some model image that insertion.

