Figure 4.
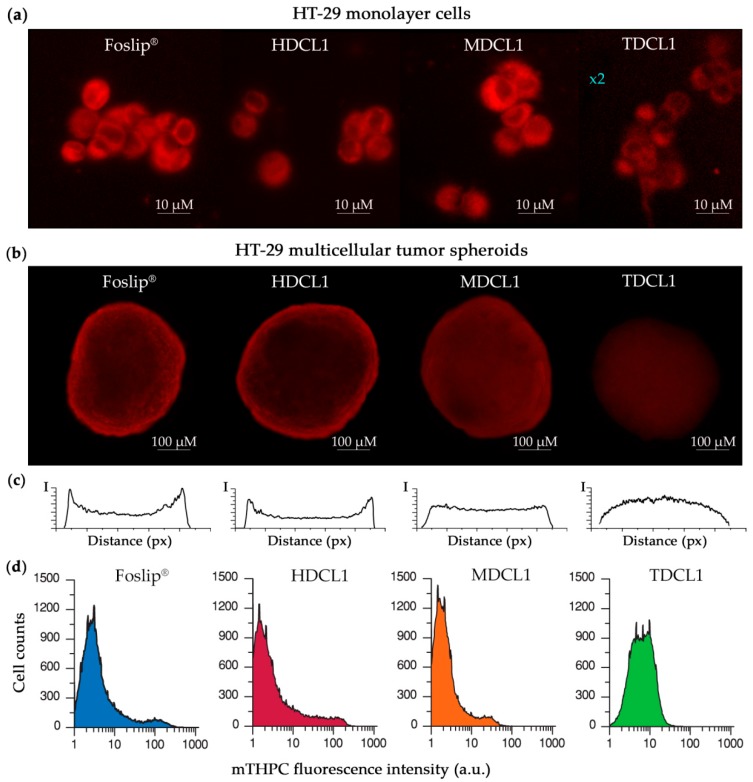
(a) Fluorescence images of mTHPC in different formulations in HT-29 monolayer cells 3 h post-incubation. (b) Fluorescence patterns of mTHPC in different formulations in HT-29 MCTSs 24 h post-incubation. (c) Linear profiles of mTHPC fluorescence intensity in HT-29 MTCSs treated by different mTHPC liposomal formulations for 24 h. (d) Histograms of mTHPC fluorescence in function of cell counts in HT29 spheroids after 24 h incubation with different mTHPC formulations. Log scale mTHPC fluorescence is shown on the x-axis. mTHPC concentration for all samples was 4.5 µM.

