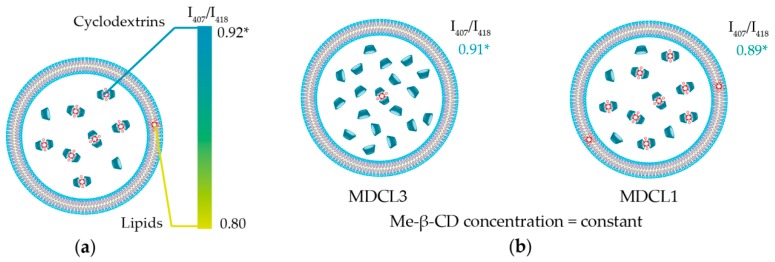
Scheme 2.
(a) Schematic representation of possible localization of mTHPC in MDCL. Color bar displays the range of I407/I418 ratios. Maximal value (0.92) corresponds to complete binding of mTHPC to Me-β-CD, while minimal ratio (0.80) displays the location of all mTHPC molecules in lipid bilayer. (b) Schematic representation of mTHPC localization in MDCLs depending on the initial mTHPC concentration. *—all values correspond to mTHPC/Me-β-CD inclusion complexes.

