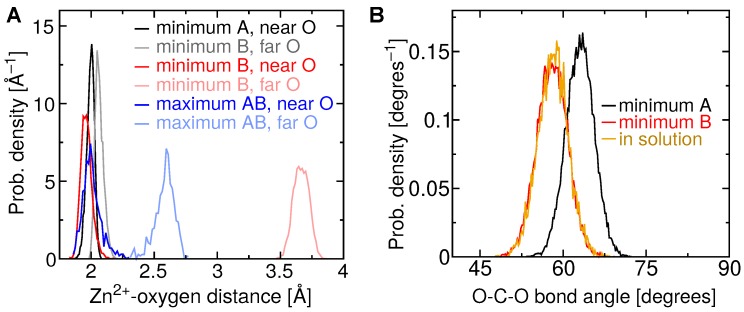
Figure 8.
Geometry of the carboxylate of betulinic acid when bound to BaP1. (A) Histogram of the distance between each carboxylate oxygen atom and the Zn ion for free-energy extrema described in Figure 7. (B) Histogram of the O–C–O bond angle adopted by the carboxylate group of betulinic acid near free-energy minima A and B, and in the aqueous phase.

