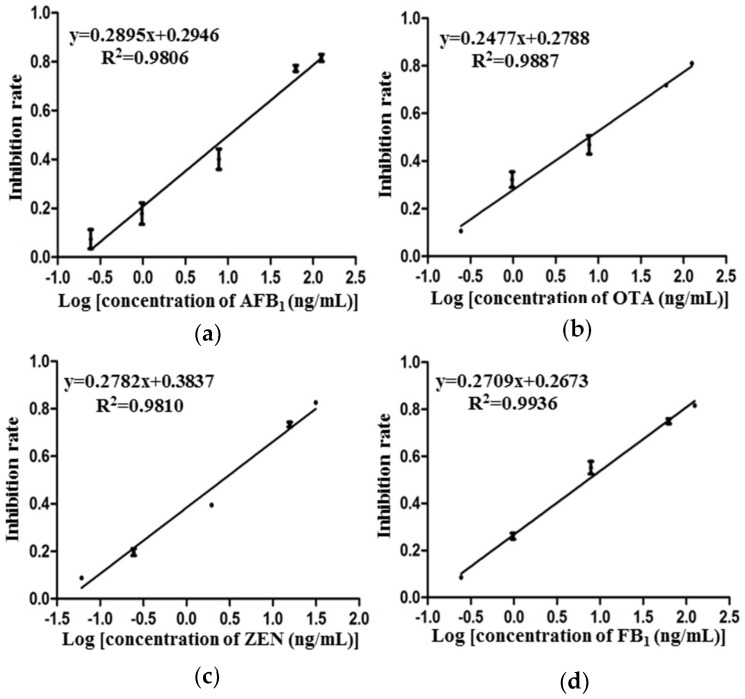
Figure 5.
Standard curves of four mycotoxins in antibody microarray immunoassay. The log concentration of mycotoxins ((a): AFB1, (b): OTA, (c): ZEN, (d): FB1) is on the x-axis, while the inhibition rate is on the y-axis. Error bars indicate the standard deviation (data collected from three replicates).

