Figure 2.
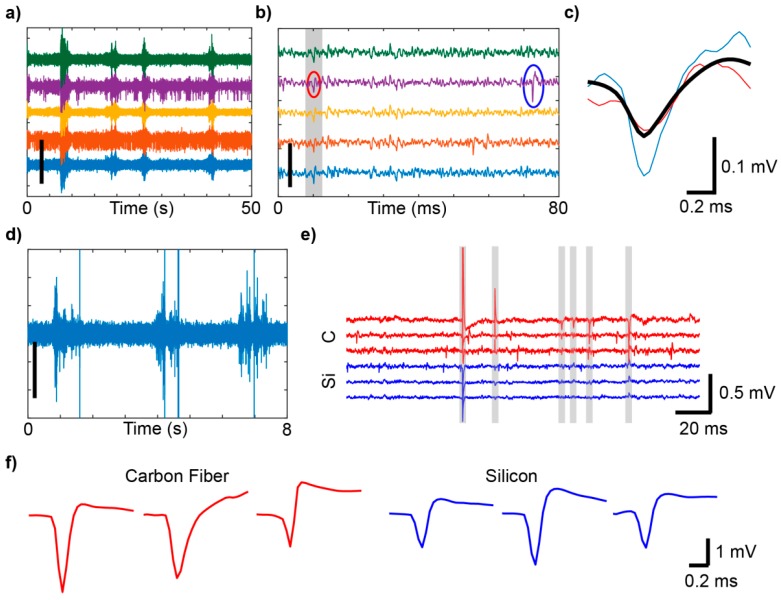
Animal movement creates artifacts that contaminate electrophysiological recordings. (a) Sample recordings from a silicon electrode array implanted in an awake, freely moving mouse. (b) Same as (a), over 80ms. Gray shading highlights artifacts. A true action potential is circled in blue, while an artifact recorded on the same channel is circled in red. (c) Example spike and artifact waveforms from (b). In this case, principal component analysis (PCA) and k-means clustering failed to separate the highlighted artifact (red) from the action potential (blue). The cluster average (black), as isolated with PCA and k-means clustering, is shown for comparison. (d) Brief recordings from an un-implanted microwire, where the electrode was moved three times with a non-conductive zip tie. (e) Sample recording data taken simultaneously from a carbon fiber array (red) and a silicon array (blue) implanted in right and left primary motor cortex in a rat, respectively. Gray shading highlights artifacts that were flagged using the detection method described previously. (f) Examples of artifacts from the carbon fiber array (red) and silicon array (blue). Scalebars: (a,b) 400 µV, (c,d) 100 µV. (a–e): © IOP Publishing. Adapted with permission from [20]. All rights reserved.

