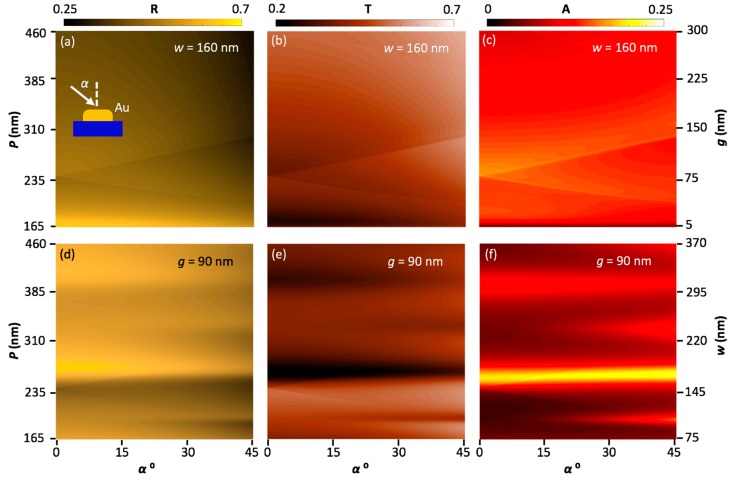
Figure 2.
Color maps of reflection (R), transmission (T) and absorption (A) as a function of angle of incidence (α). In (a–c), the period was changed by varying the nano-slit width (g), and in (d–f), by varying the wire width (w). In (a–c), w and t are fixed at 160 and 15 nm, respectively, while in (d–f), g and t are fixed at 90 and 15 nm, respectively. Also, g, w, and α were swept from 5 to 300 nm, 75 to 370 nm, and 0° to 45° in steps of 1 nm, 1 nm, and 1°, respectively.

