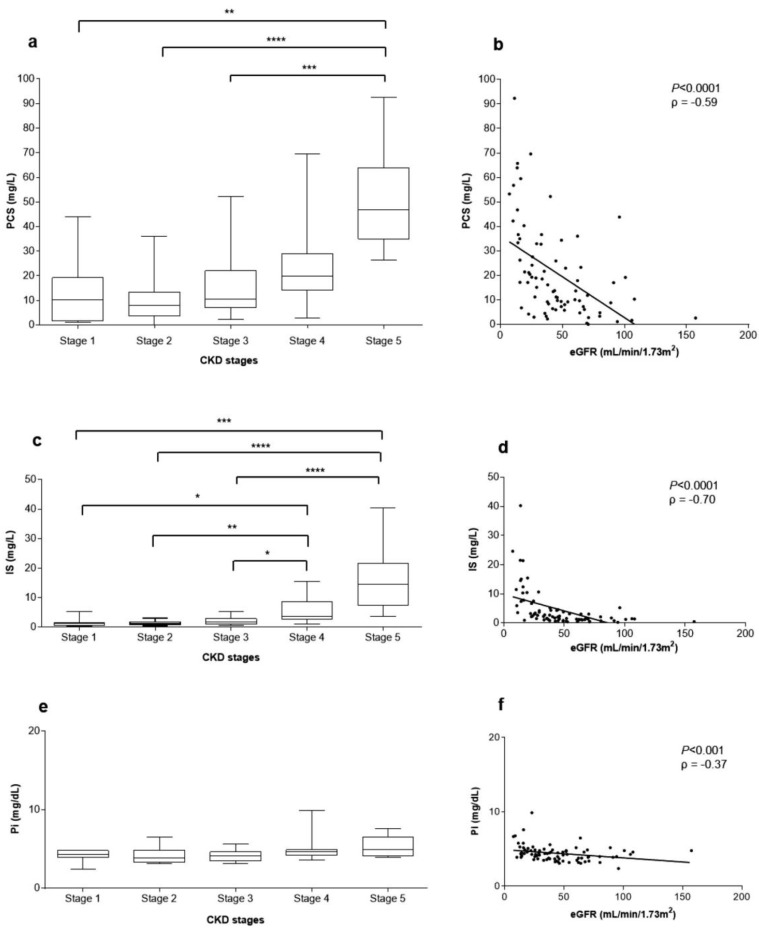
Figure 1.
Uremic toxins’ serum concentrations and correlation with eGFR. Right panel. Box plots of the p-cresyl sulfate (PCS) (a), indoxyl sulfate (IS) (c) and inorganic phosphate (Pi) (e) serum concentrations in patients’ according to their chronic kidney disease (CKD) stages. Left panel. Correlation between PCS (b), IS (d), Pi (f) serum concentrations and eGFR in CKD patients (**** P < 0.0001, ρ = −0.59; *** P < 0.0001, ρ = −0.70; ** P < 0.001, ρ = −0.37, respectively).

