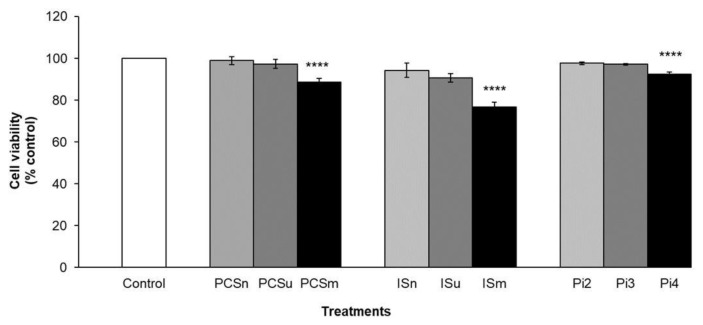
Figure 3.
Effect of PCS, IS and Pi on cell viability. Cells were incubated with the various concentrations of uremic toxins or serum for 24 h. Cell viability was assessed using the MTT (3-(4,5-Dimethylthiazol-2-yl)-2,5-diphenyltetrazolium bromide) method. Control (non-treated cells); PCS normal (PCSn) and IS normal (ISn) at normal concentrations; PCS uremic (PCSu) and IS uremic (ISu) at minimum uremic concentrations; PCS maximum uremic (PCSm) and IS Maximum uremic (Ism) at maximal uremic concentrations; inorganic phosphate at 2 mM (Pi2), 3 mM (Pi3), and 4 mM (Pi4). Results are expressed as % of control (non-treated cells). **** P < 0.0001 for PCSm, Ism, and Pi4 vs. control.

