Figure 7.
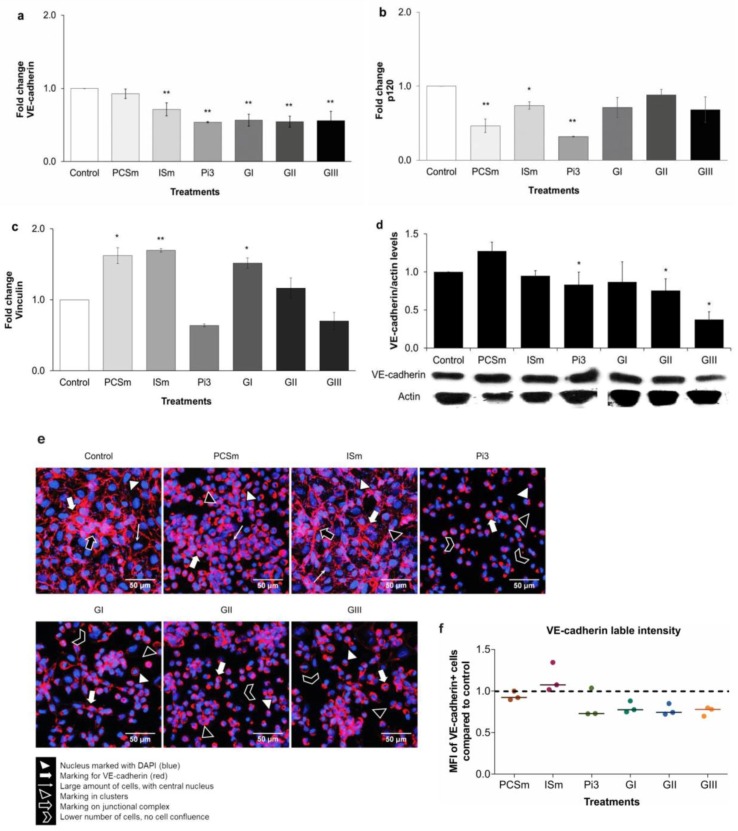
Uremic environment impacts endothelial cell adherent junctions and VE-cadherin expression. Control (non-treated cells). Effect of uremic toxins and uremic pools on VE-cadherin, p120 and vinculin gene expression: VE-cadherin-** P < 0.01 for ISm, Pi3, GI, GII, and GIII vs. Control (a); p120-** P < 0.01 for PCSm and Pi3 vs. Control (b); vinculin-* P < 0.05 for PCSm and GI vs. Control and ** P < 0.01 for ISm vs. Control (c). Effect of uremic toxins and uremic pools on VE-cadherin protein expression: by immunoblotting: Actin was used as protein loading control. Lower panel: A representative immunoblot of 8 experiments. Upper panel: Quantification of the bands (d), by immunofluorescence staining: Magnification 600× (e) and by flow cytometry: Fluorescence intensity was evaluated by flow cytometry and quantified using Flowing 2 software. Dots represent median fluorescence intensity (MFI) compared to control (non-treated cells; dashed lines) in each experiments (n = 6). Bars represent median of all values for each group (f).

