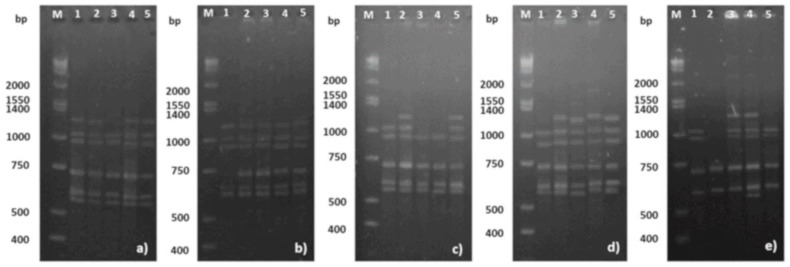
Figure 5.
Electrophoresis pattern of ISSR banding profiles of five plants (1–5) of V. planifolia exposed to AgNPs for six weeks on in vitro culture. The amplification for UBC 825 primer corresponding to (a–e) 0, 25, 50, 100, and 200 mg/L of AgNPs, respectively. M = molecular mass marker 1 kbp plus DNA ladder; bp = base pairs.

