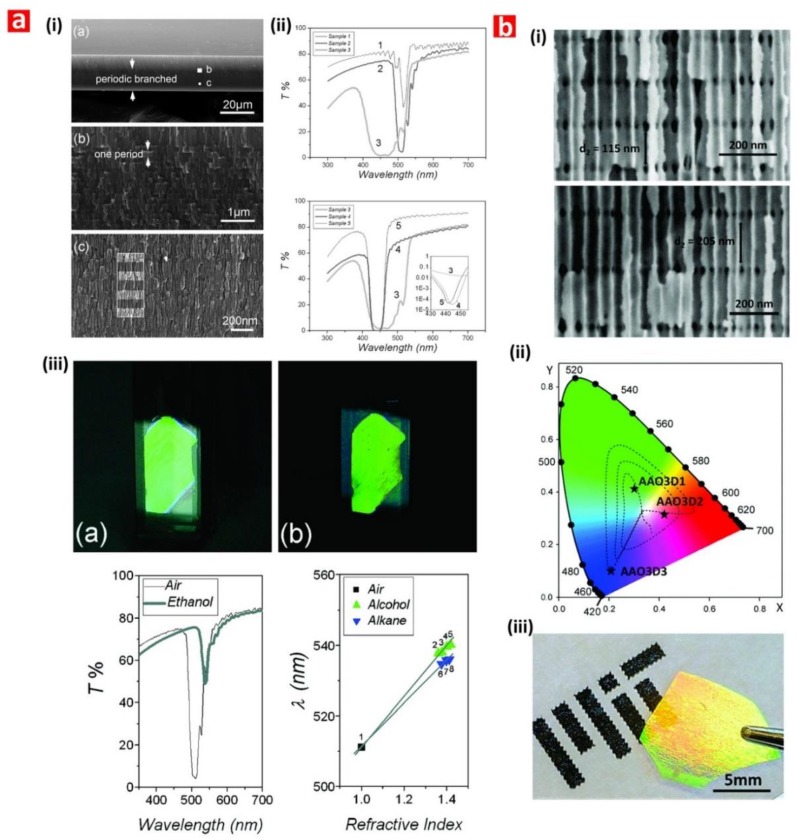
Figure 9.
Examples of applicability of NAA-PCs in chemo- and biosensing applications. (a) (i) SEM images of NAA-DBRs, (ii) transmission spectra of NAA-DBRs as a function of the fabrication conditions, and (iii) interferometric colors, transmission spectra, and position of the PSB for different media filling, Reproduced from [234], with copyright permission from American Chemical Society, 2008. (b) (i) SEM images of NAA-DBRs, (ii) position within the CIE color space, and (iii) digital images showing the interferometric color of NAA-DBRs at different fabrication conditions. Reproduced from [235], with copyright permission from American Chemical Society, 2018.

