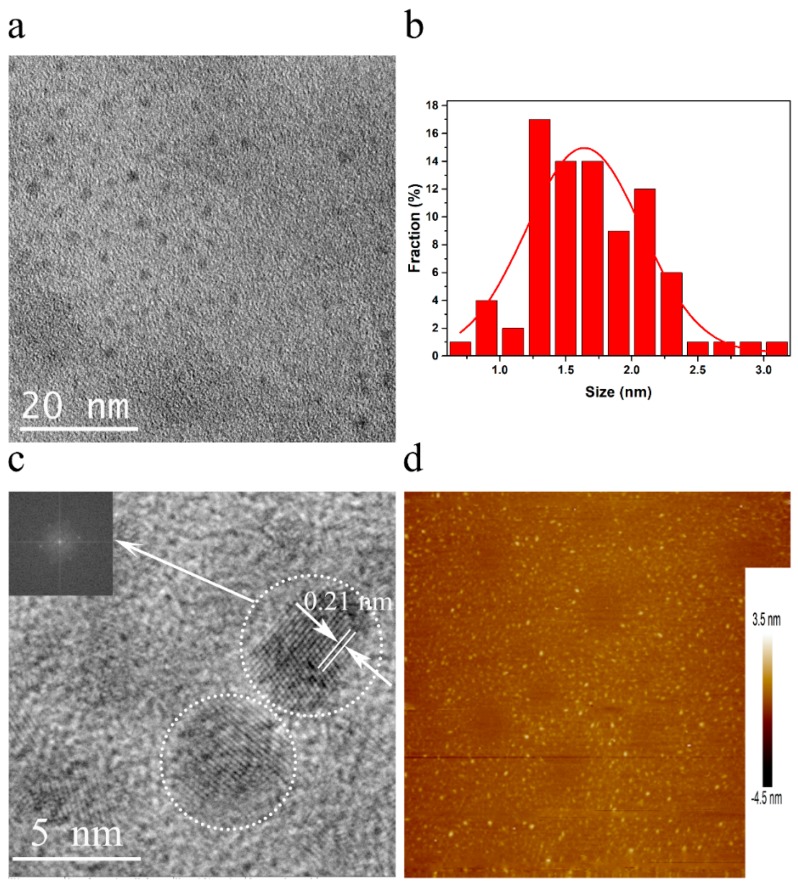
Figure 2.
TEM and AFM images of GQDs-1. (a) TEM image of GQDs-1 displaying a regular size and distribution. Scale bar, 20 nm. (b) The size distribution of GQDs-1 in (a). (c) HRTEM image of representative GQDs-1 from (a); the inset is the 2D FFT pattern showing the crystalline hexagonal structure of these quantum dots corresponding to hexagonal graphene lattice fringes. Scale bar, 5 nm. (d) AFM image of GQDs-1 deposited on freshly cleaved mica substrates.

