FIGURE 1.
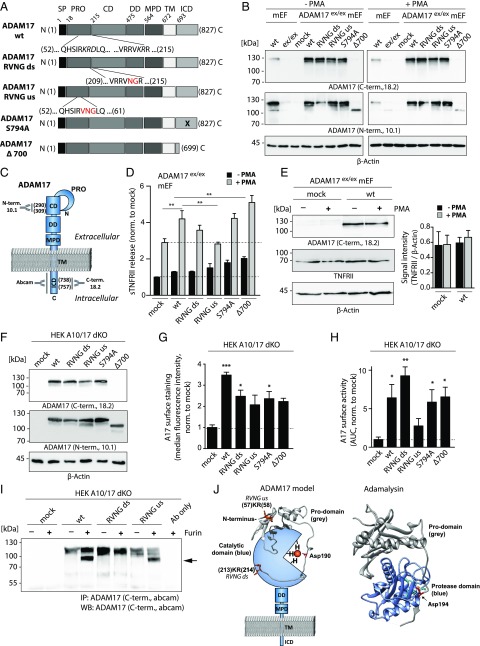
Functional and structural analyses of ADAM17 mutants in mEF and HEK cells. (A) Schematic overview of the 827-aa-long murine ADAM17 protein subdivided in different domains and ADAM17 mutants analyzed in this study. Mutations introduced in the prodomain to generate the RVNG ds and RVNG us mutants are indicated by red letters. The location of the S794A point mutation is indicated by a black cross, and the ADAM17 Δ700 mutant is truncated after aa 699. (B) Immunoblot of endogenous ADAM17 in wt mEF and transiently overexpressed ADAM17 in mEF exhibiting an ADAM17 knockdown (ADAM17ex/ex). Cells were nonstimulated (−PMA) or stimulated with PMA for 2 h. C-terminal (18.2) as well as N-terminal (10.1) Abs were used to detect ADAM17, indicating uniform expression of all ADAM17 mutants. The Δ700 can only be detected by the N-terminal Ab. β-Actin was used as loading control. (C) Schematic model of ADAM17 protein indicating binding sites of used Abs. The polyclonal N-terminal ADAM17 Ab 10.1 was designed against a peptide (aa 290–309) in the catalytic domain (CD). Both C-terminal Abs (ab39162 and house-made 18.2; Abcam) are polyclonal and were designed against a cytoplasmic epitope. The 18.2 Ab was designed to bind a peptide (aa 738–757) within the intracellular domain (ICD). (D) ELISA of endogenous TNFRII in supernatants of ADAM17ex/ex mEF reconstituted with each respective ADAM17 mutant, showing constitutive shedding activity (black bars) and TNFRII shedding after a 2-h PMA stimulation (gray bars). The dotted line marks baseline TNFRII shedding (n = 3 from three individual transfections). (E) Endogenous TNFRII protein level in ADAM17ex/ex mEF after mock transfection and reconstitution with ADAM17 wt with and without a 2-h PMA stimulation. Signal intensity analysis of TNFRII normalized to loading control (β-actin) indicates unchanged TNFRII level. (F) Representative immunoblot of ADAM17 mutants transiently overexpressed in ADAM10/ADAM17 double-deficient HEK cells (HEK A10/A17 dKO) detected by a C-terminal (18.2) as well as N-terminal Ab (10.1) showing equal ADAM17 protein level. β-Actin was used as loading control. (G) Cell surface FACS analysis of ADAM17 overexpressed in HEK A10/A17 dKO cells stained with extracellular N-terminal Ab 10.1. Single cells (FSC-A × FSC-H) were gated and plotted for secondary Ab signal (Alexa Fluor 488). Bar graph shows median fluorescence intensity after normalization to mock transfection (n = 3 from three individual transfections). (H) ADAM17 life cell surface activity assay in ADAM17-reconstituted HEK A10/17 dKO cells by fluorogenic peptide cleavage assay. Protease activity was determined by measuring fluorescence intensity of the cleaved peptide on living cells for 6000 s. The area under the curve of fluorescent signal over time was calculated and normalized to the mock-transfected control (n = 3 from three individual transfections). (I) Representative Western blot of three individual experiments (anti C-terminal Ab [Abcam]) of a furin cleavage assay. Lysates of ADAM17-transfected HEK A10/A17 dKO cells were immunoprecipitated by a C-terminal Ab (Abcam) and incubated with 1 U of recombinant furin. Upper ADAM17 band (∼120 kDa) indicates full-length and nonfurin-processed ADAM17 form. After furin cleavage of the prodomain, the mature ADAM17 migrates at ∼90 kDa (black arrow). (J) Protein model of ADAM17 highlighting catalytic and prodomain (gray). In orange, the us and ds furin cleavage sites are indicated. The prodomain of ADAM17 and its orientation toward the catalytic domain were modeled on the basis of the previously published adamalysin crystal structure [right; PDB:3P24 (39)] using Swiss Model Expasy. The red highlighted Asp194 in adamalysin is analog to the Asp190 in the prodomain of ADAM17. Both aspartates interact with a zinc ion (orange dot). Molecular imaging was performed using UCSF Chimera. For statistical analyses, a two-sided Student t test was used in (E), exhibiting no statistically significant differences. A one-way ANOVA followed by a Tukey multiple comparison test was applied in (D), (G), and (H). CD, catalytic domain; DD, disintegrin domain; ICD, intracellular domain; MPD, membrane proximal domain; PRO, prodomain; SP, signal peptide; TM, transmembrane domain. *p < 0.05, **p < 0.01, ***p < 0.005.

