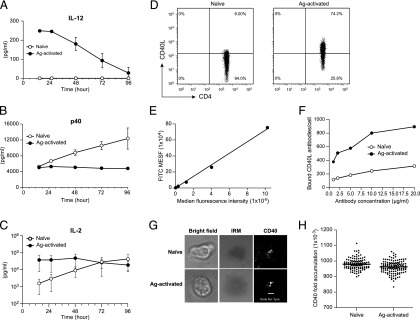
FIGURE 1.
Naive T cells do not induce IL-12 production from DCs. (A) BMDCs from B10.A-RAG2−/− mice were preactivated with 200 ng/ml LPS for 22 h after being washed and cocultured at 1 × 10⁵ cells per well with 5 × 10⁵ cells per well naive or Ag-activated 5C.C7-1 RAG2−/− T cells in the presence of 0.1 μm MCC in 24-well plates. CSN collected at various time points (without addition of fresh medium to the cells) were tested for the presence of IL-12 using cytokine array. These data are expressed as the mean ± SD of two independent experiments of single well. (B) Same conditions as (A), except the p40 subunit was measured in the CSN. (C) Same conditions as (A), except IL-2 was measured in the CSN. (D) Naive or Ag-activated T cells were stained with 1 μg of anti-CD40L and were analyzed using flow cytometry. (E) Standard curve generated using FITC standard beads with a previously determined number of FITC molecules on the surface of the beads. (F) Same conditions as (D), except naive or Ag-activated T cells were stained with various concentrations of anti-CD40L/FITC. The MFI of labeled cells was converted to the average number of FITC molecules per cell from a standard curve generated using FITC standard beads (E) representative of two independent experiments, single replicate. (G) A total of 1 × 10⁶ naive or Ag-activated T cells along with Alexa Fluor 647 conjugated 6xHis CD40 (sCD40) were injected into the flow chamber systems (FCS2) that were loaded with MHC class II I-Ek-T102S, ICAM-1, and CD80 into Ni-NTA lipid–supported bilayer at 37°C. T cells were imaged for 30 min after stable synapse formation on the supported bilayer. Scale bar, 2 μm. (H) Same as (G), the average fluorescence intensities of naive and Ag-activated T cells determined by normalizing the images to the background to calculate the fold accumulation of CD40. Although the mean difference between naive and Ag-activated cells (H) was statistically significant, determined by Student t test. The magnitude of the difference between naive and Ag-activated T cells was quite small, and the statistical significance is entirely driven by the large sample sizes. Representative of two independent experiments of single replicate.

