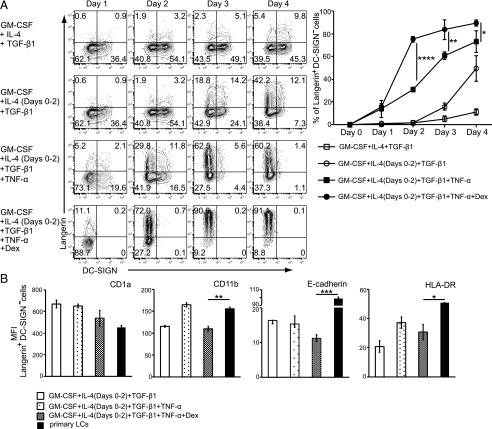
FIGURE 4.
Phenotype of Langerin+ moLCs induced from CD14+ monocytes in the presence of GM-CSF and TGF-β1. (A) Monocytes were differentiated into Langerin+ cells using the following methods: GM-CSF, IL-4, and TGF-β1 (upper panel); GM-CSF, IL-4 (day 0–2), and TGF-β1 (second panel); GM-CSF, IL-4 (day 0–2), TGF-β1, and TNF-α (third panel); and GM-CSF, IL-4 (day 0–2), TGF-β1, TNF-α, and 10−8 M Dex (lower panel). The percentage of Langerin+DC-SIGN− cells from three independent experiments is shown in the right panel (±SEM). (B) The respective surface phenotype of moLCs compared with primary LCs. The surface expression of CD1a, CD11b, E-cadherin, and HLA-DR was analyzed by flow cytometry. Mean fluorescence intensity (MFI) from three independent experiments is shown in the right panel (+SEM). *p < 0.05, **p < 0.01, ***p < 0.001, ****p < 0.0001, Student t test.

