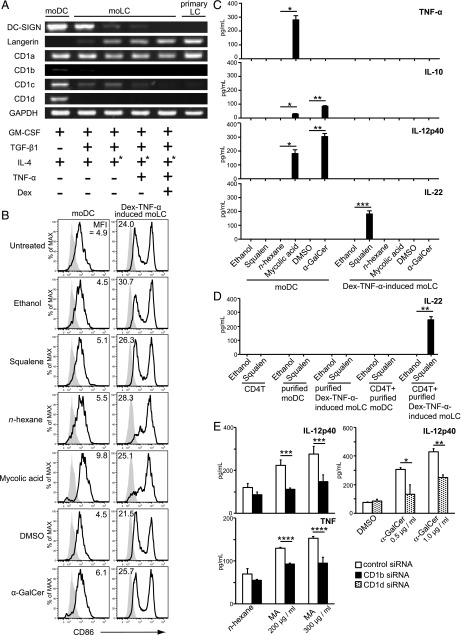
FIGURE 5.
Analysis and comparison of the moDCs, moLCs established by various methods, and primary LC. (A) mRNA was isolated from moDCs, moLCs, and freshly isolated epidermal LCs. cDNA was amplified using the primers described in Materials and Methods. PCR products are shown in the figure. GAPDH was used as a control. IL-4 was washed out from culture medium at day 2 (+*). (B) moDCs and Dex–TNF-α–induced moLCs were resuspended in 24-well culture plates or test tubes at a concentration of 5 × 10⁵ cells/ml. Squalene, MA, or α-GalCer was added, and the cells were incubated for 48 h. Subsequently, the cells were stained with anti-CD86 mAb and analyzed by flow cytometry compared with DMSO, n-hexane, or ethanol control, respectively. Gray histograms indicate the isotype-matched negative control. Results are representative of four independent experiments. (C) moDCs and Dex–TNF-α–induced moLCs were stimulated for 48 h with 500 μM squalene, 500 μg/ml MA, or 2.0 μg/ml α-GalCer. Levels of cytokines TNF-α, IL-10, IL-12p40, and IL-22 in the cell supernatants were examined by ELISA. Data are shown as the mean + SEM of results pooled from four independent experiments. *p < 0.05, **p < 0.01, ***p < 0.001, Student t test. (D) Purified Dex–TNF-α–induced moLCs were cocultured with autologous CD4+ T cells for 48 h in the presence of 500 μM squalene. IL-22 production was measured in the culture supernatant using ELISA. Data are shown as the mean + SEM of results pooled from three independent experiments. **p < 0.01, Student t test. (E) Cytokine production of IL-12p40 and TNF-α by CD1b siRNA or CD1d siRNA transfected cells in response to the respective stimuli for 24 h was examined by ELISA. Data are shown as mean + SEM of the results pooled from five independent experiments. *p < 0.05, **p < 0.01, ***p < 0.001, ****p < 0.0001 by multiple comparisons using the Holm–Sidak Method.

