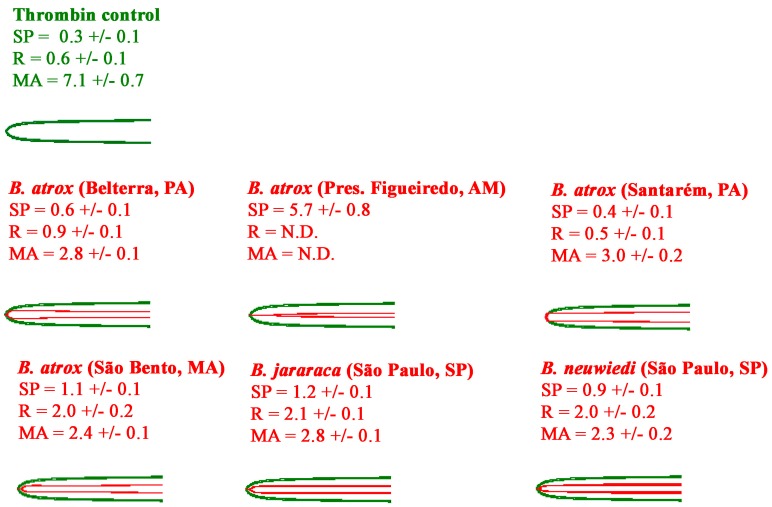
Figure 6.
Variations in the ability of venoms to clot human fibrinogen, measured on Haemonetics TEG5000 thromboelastography analysers for 30 min. For visualisation purposes, the venom experimental traces are overlaid with the thrombin control. All traces are n = 3. Values are n = 3 means and standard deviation. SP = Split Point- the time at which clot formation starts; R = time to reach 2 mm amplitude; MA = maximum amplitude.

