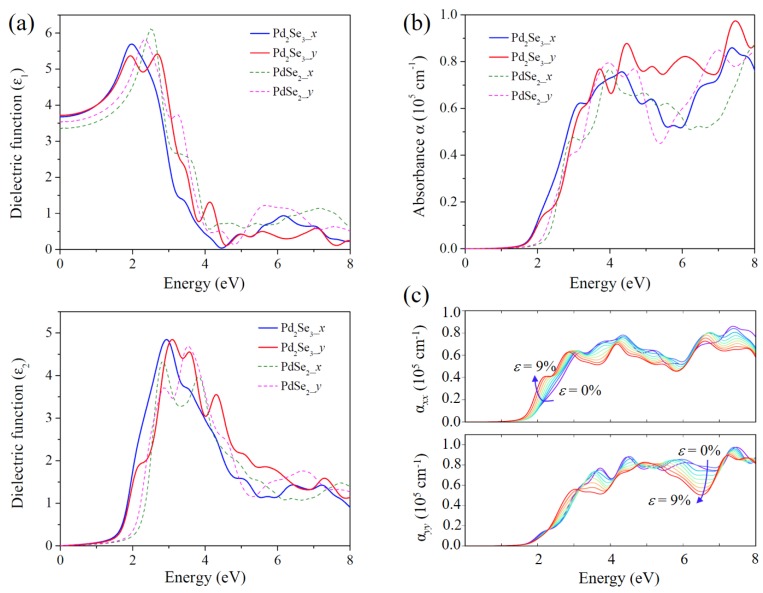
Figure 4.
(a) Real part (ε1) and imaginary part (ε2) of the complex dielectric function, and (b) optical absorption spectra of Pd2Se3, as compared to those of PdSe2 along the x and y directions respectively; (c) Optical absorption spectra of Pd2Se3 under different biaxial strains from 0% (violet line) to 9% (red line).

