Figure 6.
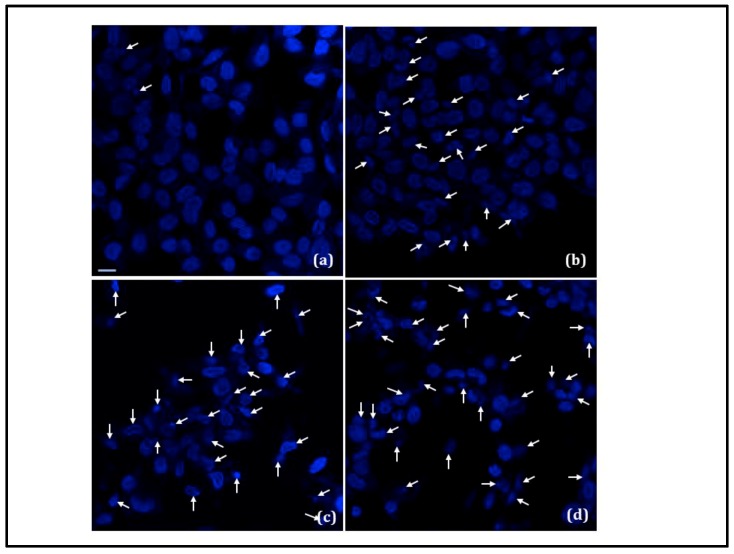
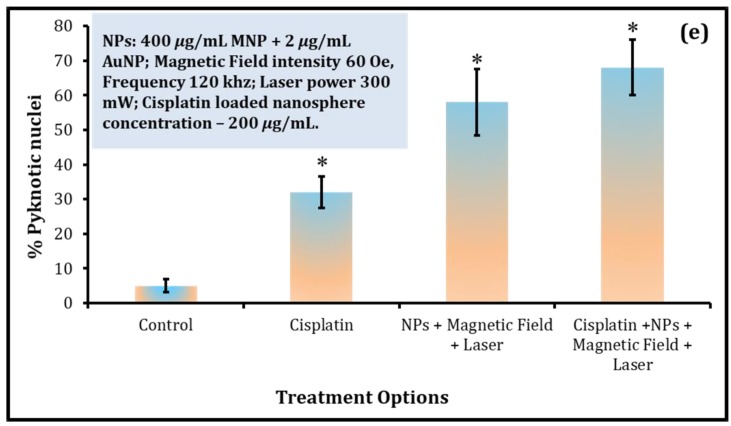
Nuclear condensation and fragmentation (white arrows) under the following conditions: (a) control, (b) presence of 200 µg/mL CPNPs, (c) combined optical-AC magnetic field irradiation in the presence of NPs (400 µg/mL MNP + 2 µg/mL AuNP), and (d) combined optical-AC magnetic field irradiation in the presence of NPs and CPNPS. AC Magnetic field intensity was 60 Oe, frequency was 120 kHz, and laser power was 300 mW (at 520 nm). Scale bar is 10 µm in (a), and is also applicable for (b–d). (e) Bar chart displaying quantification of pyknotic nuclei, indicative of cell death. Data are means ± SEM from four separate experiments and * indicates statistically significant differences, compared to cells cultured as the control, at p < 0.01 (ANOVA and LSD post-hoc).


