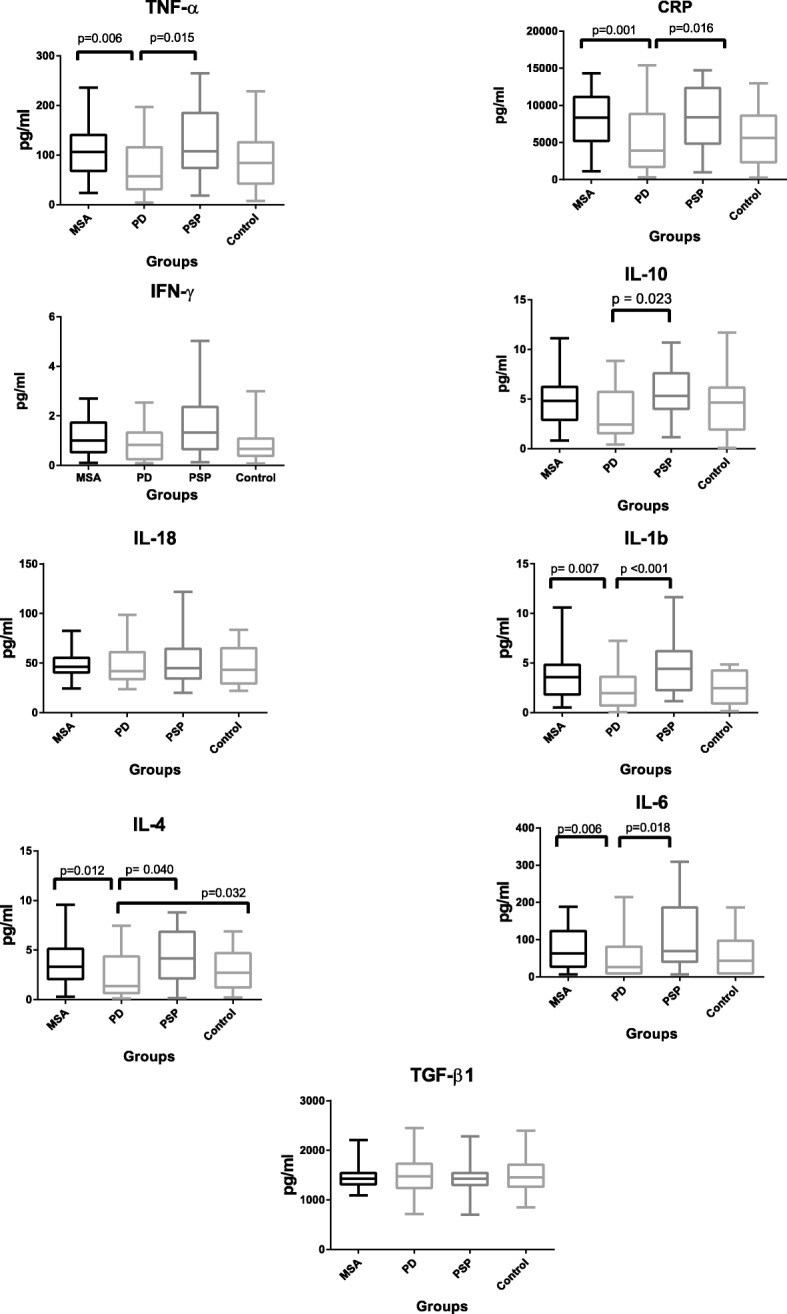
Fig. 1.

Box plots of CRP and eight selected cytokines plotted in diagnostic groups. The plots are presented without outliers. p values are adjusted for age, gender, and use of anti-inflammatory medication

Box plots of CRP and eight selected cytokines plotted in diagnostic groups. The plots are presented without outliers. p values are adjusted for age, gender, and use of anti-inflammatory medication