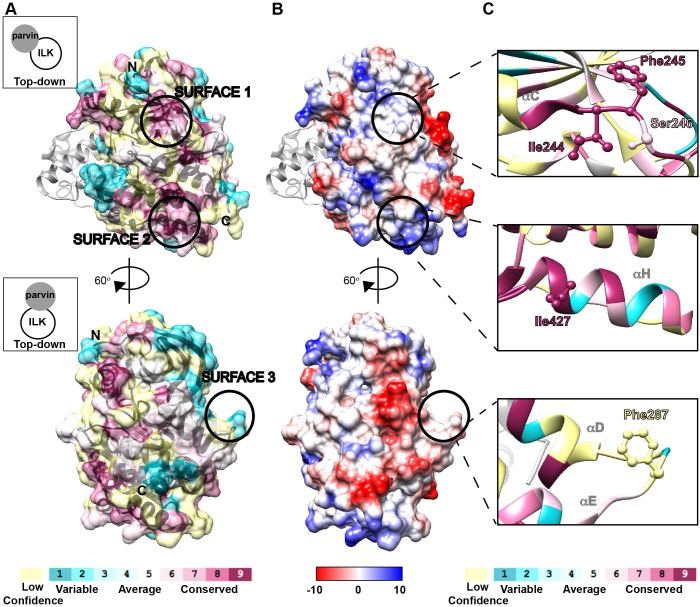
Fig. 1.
Selection of highly conserved, hydrophobic patches on the ILK-pKD by surface mapping. (A) ConSURF (Landau et al., 2005) surface map generated from 37 species of ILK-pKD mapped onto the previously determined crystal structure of the ILK-pKD in complex with α-parvin-CH2 (gray ribbon) bound to MgATP (not visible in orientations shown), generated with Chimera software (Pettersen et al., 2004), and shown in two different orientations related by a 60° rotation as indicated (PDB ID: 3KMW). Schematic representing a top-down view of the complex to show the relative orientation of α-parvin-CH2 to the ILK-pKD (left). Color scale (bottom of panel), with positions for which the conservation score was assigned with low confidence indicated in light yellow. Color-coded surface is shown at 50% transparency, with ribbon structure in black. N- and C-termini are indicated. (B) Coulombic surface map indicating the electrostatic potential was generated by using Chimera software (Pettersen et al., 2004) for each orientation of the ILK-pKD–α-parvin-CH2 complex shown in Fig. 1A. Color scale (bottom of panel) is given in units of kcal mol−1 e−1 at 298 K. (C) Ribbon diagram of selected regions from the ConSURF map shown in A. Residues selected for mutagenesis are shown as ball-and-stick display.

