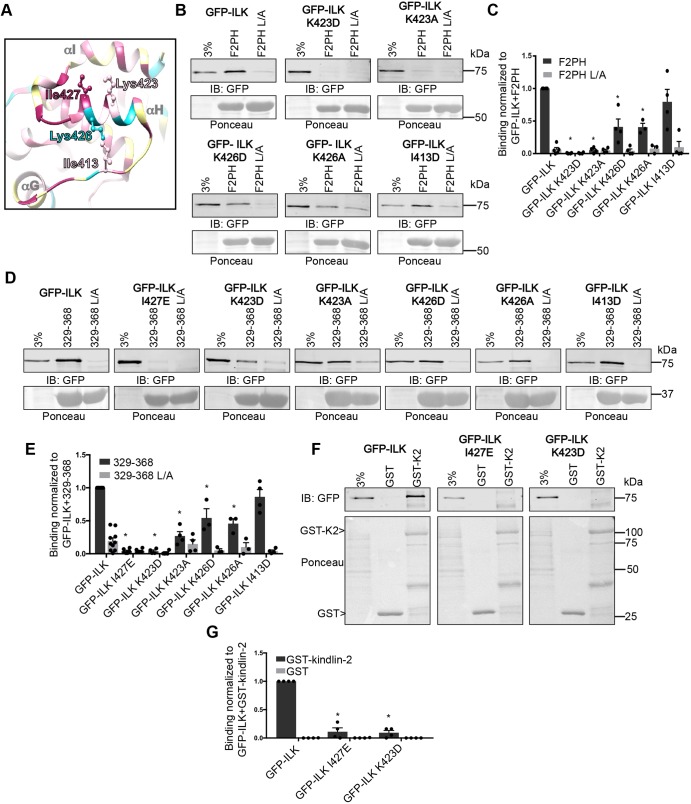
Fig. 3.
Additional residues on αH in the ILK-pKD are implicated in the interaction with kindlin-2. (A) Ribbon diagram of helix-αH and surrounding residues in the ILK-pKD–α-parvin-CH2 co-crystal structure (PDB ID: 3KMW) generated with Chimera software (Pettersen et al., 2004). Residues selected for mutation are labeled and shown as a ball-and-stick representation. Conservation coloring is indicated using the same color scale as shown in Fig. 1A. (B,C) Pulldown of GFP–ILK or GFP–ILK mutants by GST–kindlin-2 F2PH and GST–kindlin-2 F2PH L357A (L/A) from CHO cell lysate co-overexpressing FLAG–α-parvin assessed by representative immunoblots (B) and quantified (C); mean±s.e.m.; n≥3; *P<0.001 (Student's t-test). (D,E) Pulldown of GFP–ILK or GFP–ILK mutants from CHO cell lysate co-overexpressing FLAG–α-parvin using GST–kindlin-2 329-368 or GST–kindlin-2 329-368 L/A were assessed by representative immunoblots (D) and quantified (E); mean±s.e.m.; n≥3; *P≤0.0006. (F,G) Pulldown of GFP–ILK or GFP–ILK mutants from CHO cell lysate co-overexpressing FLAG–α-parvin using GST or GST–kindlin-2 were assessed in representative immunoblots (F) and quantified (G); mean±s.e.m.; n=4; *P≤0.0001 (Student's t-test). Pulldown quantification graphs are shown as bar charts with individual data points plotted (dots). GST- protein loading is indicated by Ponceau S staining.

