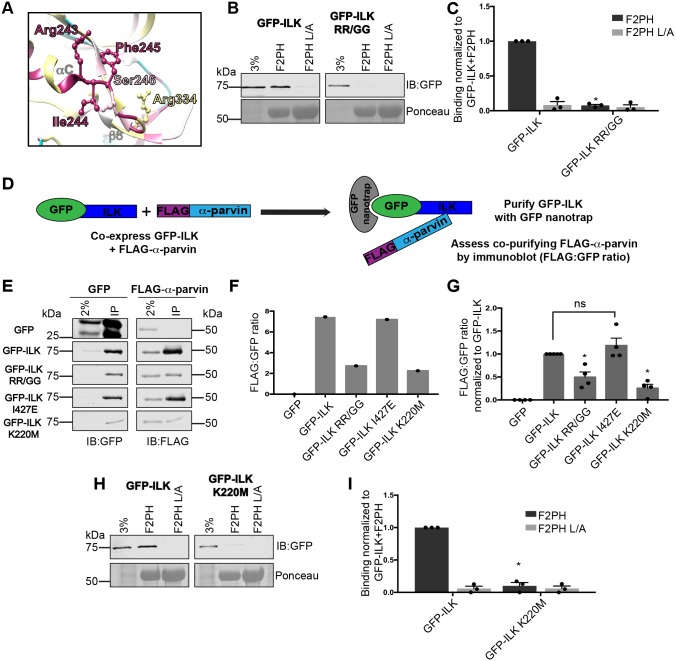
Fig. 5.
R243G/R334G double mutation of GFP–ILK (GFP–ILK RR/GG) impairs binding of the ILK to α-parvin. (A) Ribbon diagram of selected regions in the ILK KD–α-parvin-CH2 complex co-crystal structure (PDB ID: 3KMW) surrounding I244, F245, and S246, generated with Chimera software (Pettersen et al., 2004). Residues selected for mutagenesis are labeled and shown as a ball-and-stick representation. Conservation coloring is indicated using the same color scale as shown in Fig. 1A. (B,C) Pulldown of GFP–ILK or GFP–ILK RR/GG from CHO cell lysates co-overexpressing FLAG–α-parvin using GST–kindlin-2 F2PH or GST–kindlin-2 F2PH L357A (L/A) assessed by representative immunoblots (B) and quantified (C); mean±s.e.m.; n=3; *P≤0.0001 (Student's t-test). (D) Diagram of the GFP nanotrap experiment. GFP–ILK was purified from lysate of cells co-expressing GFP–ILK and FLAG-α-parvin. The amount of co-purifying FLAG–α-parvin was assessed by immunoblotting and the FLAG:GFP ratio for each construct was calculated. (E,F) GFP-nanotrap co-purification of GFP–ILK constructs co-expressed FLAG–α-parvin in CHO cells was assessed by immunoblot from one experiment (E) and quantified (F) as a raw FLAG:GFP ratio. Dots represent single data points for each construct tested. The lane labeled ‘2%’ indicates the 2% input of lysate. (G) The FLAG:GFP ratio for each GFP or GFP–ILK construct tested is expressed relative to the FLAG:GFP ratio of the GFP–ILK control within each experiment, which is set to 1. The dataset includes the experiment shown in E and F (mean±s.e.m.; n≥4); *P≤0.0015; ns, statistically not significant, P>0.05 (Student's t-test). (H,I) Pulldown of GFP–ILK K220M from CHO cell lysate co-overexpressing FLAG–α-parvin using GST–kindlin-2 F2PH or GST–kindlin-2 F2PH L/A assessed by representative immunoblot (H) and quantified (I); mean±s.e.m.; n=3; *P≤0.0001. Pulldown and co-purification quantification graphs are shown as bar charts with individual data points plotted (dots). GST-protein loading control for pulldown experiments is indicated by Ponceau S staining.

