Fig. 7.
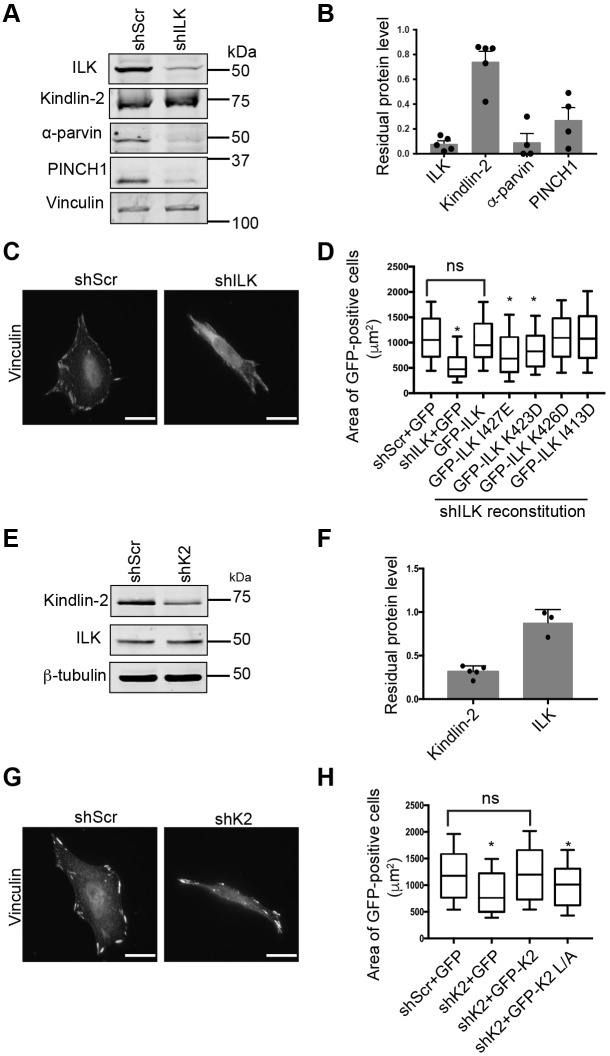
The ILK–kindlin-2 interaction is important for normal cell spreading in HeLa cells. (A) Immunoblotting of shScr and shILK HeLa cells to show protein levels of ILK, kindlin-2, α-parvin, PINCH1 and vinculin. (B) Bar graph showing residual protein levels in shILK cells calculated relative to those in shScr cells (mean±s.e.m.); individual data points are indicated (dots; n≥4). (C) Immunofluorescence staining of endogenous vinculin in fixed shScr or shILK HeLa cells spread on fibronectin-coated glass coverslips and acquired by epifluorescence microscopy. Scale bars: 20 µm. (D) CellProfiler quantification of GFP-positive cell areas pooled across three independent experiments shown as box and whiskers plots indicating 10th and 90th percentile range. n=155 shScr+GFP cells, 169 shILK+GFP cells, 154 shILK+GFP–ILK cells, 162 shILK+I427E cells, 143 shILK+K423D cells, 137 shILK+K426D cells, 125 shILK+I413D cells; *, significantly different from shScr+GFP calculated using one-way ANOVA and Tukey's correction for multiple comparisons (P≤0.01); ns, statistically not significant; P>0.05. (E) Immunoblotting of shScr and shK2 HeLa cells to show protein levels of kindlin-2, ILK, and β-tubulin. (F) Bar graph showing residual kindlin-2 or ILK protein levels in shK2 cells calculated relative to those in shScr cells (mean±s.e.m.); individual data points are indicated (dots; n≥3). (G) Immunofluorescence staining of endogenous vinculin in fixed shScr or shK2 HeLa cells spread on fibronectin-coated glass coverslips and acquired by epifluorescence microscopy. Scale bars: 20 µm. (H) CellProfiler quantification of GFP-positive cells areas pooled across three independent experiments; n=143 shScr+GFP cells, 121 shK2+GFP cells, 145 shK2+GFP-K2 cells, 130 shK2+GFP-K2 LA cells. Data are shown as box and whiskers plot, with whiskers indicating the 10th and 90th percentile range. *, significantly different from shScr+GFP calculated using one-way ANOVA and Tukey's correction for multiple comparisons (P≤0.015); ns, statistically not significant. Microscopy images were linearly and uniformly adjusted for clarity.

