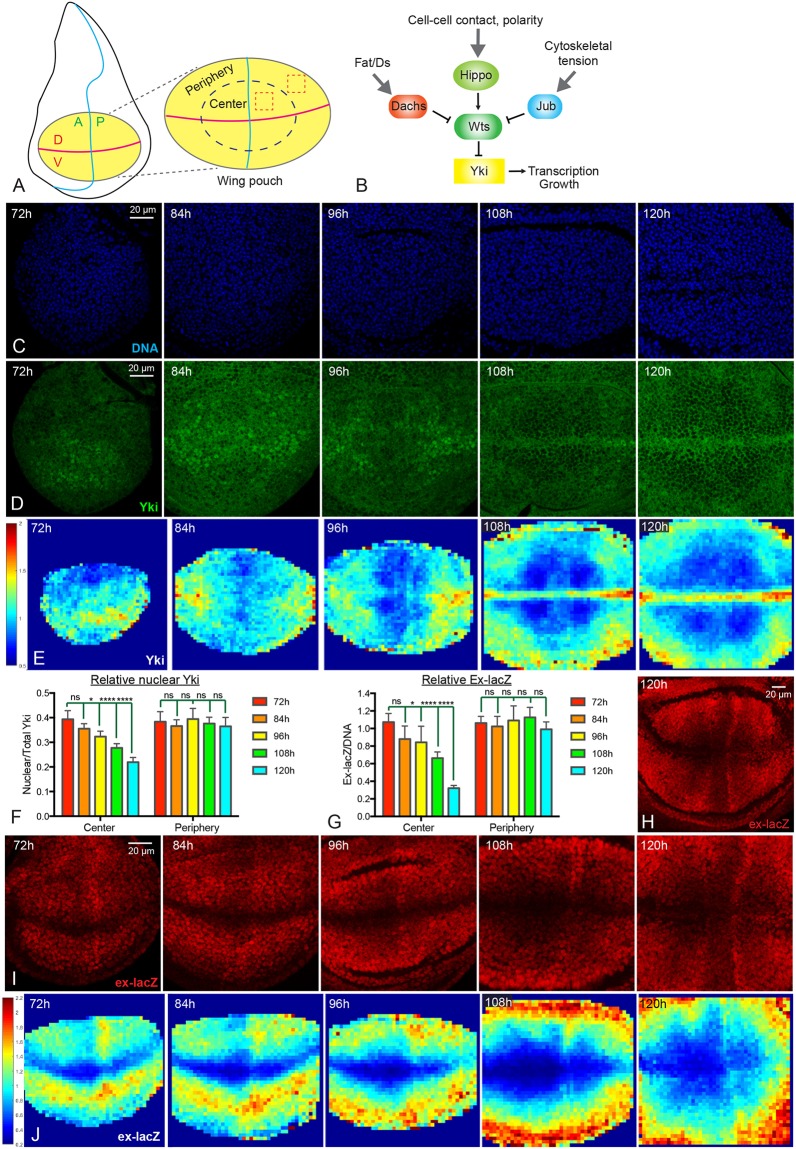
Fig. 1.
Dynamics of Yki activity during wing disc development. (A) Schematic of the Drosophila wing disc. The yellow ellipse shows the wing pouch region, which is enlarged on the right. The horizontal magenta line indicates the D-V compartment boundary; the vertical blue line indicates the A-P compartment boundary. The dashed blue ellipse is drawn approximately halfway between the center and edge of the pouch, separating it into central and peripheral regions. Examples of cuboids used for quantification are indicated by dashed red boxes. (B) Simplified schematic of the Hippo pathway which, in the wing disc, is regulated by Fat/Ds signaling through Dachs, by cell contact and cell polarity through Hippo and Wts, and by cytoskeletal tension through Jub. (C,D) Wing discs at 72 h, 84 h, 96 h, 108 h and 120 h AEL stained for DNA (blue, C) and Yki (green, D). Images were captured under identical conditions. (E) Heat maps of relative nuclear Yki intensity in wing discs from 72 to 120 h AEL. In this and subsequent figures a scale for the heat maps is indicated on the left. Number of wing discs used for analysis: 72 h, n=6; 84 h, n=5; 96 h, n=5; 108 h, n=5; 120 h, n=6. (F,G) Histograms showing relative Yki levels (F, nucleus/total) and relative ex-lacZ levels (G) in the central and peripheral regions of wing discs at different stages. Error bars indicate 95% confidence interval. For Yki, 72 h, n=11; 84 h, n=14; 96 h, n=13; 108 h, n=12; 120 h, n=12. For ex-lacZ, n=12 for each time point. Statistical comparisons are shown relative to the 72 h timepoint. (H,I) Wing discs at 72 h, 84 h, 96 h, 108 h and 120 h AEL stained for the expression of ex-lacZ (red). Images were taken under the same conditions. H is a lower magnification image of ex-lacZ at 120 h AEL. (J) Heat maps of relative nuclear ex-lacZ intensity of wing discs from 72 to 120 h AEL. Number of wing discs used for analysis: 72 h, n=5; 84 h, n=5; 96 h, n=5; 108 h, n=5; 120 h, n=5. ns, P>0.05; *P≤0.05; ****P≤0.0001. Scale bars: 20 µm.

