Fig. 2.
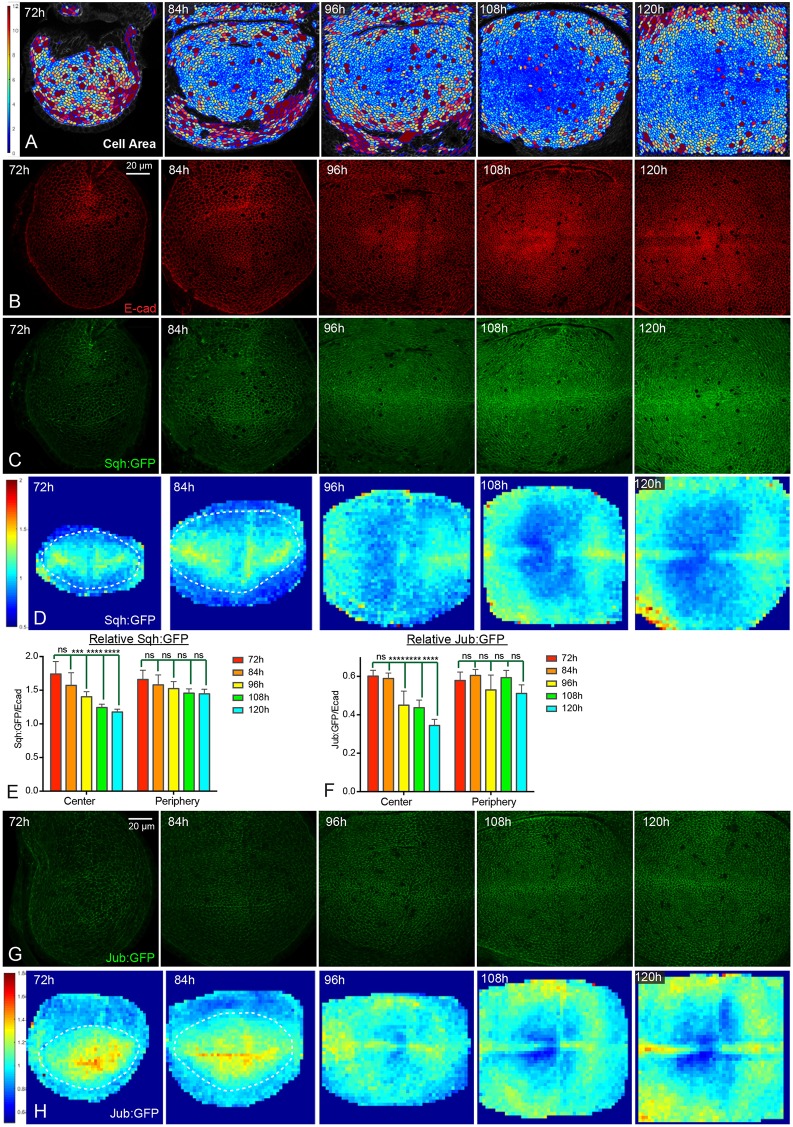
Dynamics of Jub biomechanical signaling during wing disc development. (A) Cell area color maps of wing discs at 72 h, 84 h, 96 h, 108 h and 120 h AEL. Cell areas are shown from 0 µm2 (blue) to 12 µm2 (violet). Cells larger than 12 µm2 have the same color as the 12 µm2 ones. (B,C) Wing discs stained for E-cad (red, B) and expressing Sqh:GFP (green, C) at 72 h, 84 h, 96 h, 108 h and 120 h AEL. Images were taken under the same conditions. (D) Heat map of relative junctional Sqh:GFP intensity of wing discs from 72 h to 120 h AEL. The wing pouch is demarcated with dashed lines for 72 h and 84 h as the wing pouch does not occupy the entire field analyzed here. Number of wing discs used for analysis: 72 h, n=6; 84 h, n=5; 96 h, n=5; 108 h, n=5; 120 h, n=5. (E,F) Histograms showing relative junctional Sqh:GFP levels (E) and relative junctional Jub:GFP levels (F) in the central and peripheral regions of wing discs at different stages. Error bars indicate 95% confidence interval. For Sqh:GFP, n=14 (72 h, 84 h or 108 h) or 15 (96 h or 120 h). For Jub:GFP n=12 (72 h, 84 h or 96 h), 13 (108 h) or 14 (120 h). Statistical comparisons are shown relative to the 72 h timepoint. (G) Wing discs expressing Jub:GFP (green) at 72, 84 h, 96 h, 108 h and 120 h AEL. Images were taken under the same conditions. (H) Heat map of relative junctional Jub:GFP intensity of wing discs from 72 h to 120 h AEL (red, high; blue, low). The wing pouch is demarcated with dashed lines for 72 and 84 h as the wing pouch does not occupy the entire field analyzed here. Number of wing discs used for analysis: 72 h, n=6; 84 h, n=5; 96 h, n=5; 108 h, n=6; 120 h, n=5. ns, P>0.05; ***P≤0.001; ****P≤0.0001. Scale bars: 20 µm.

