Fig. 6.

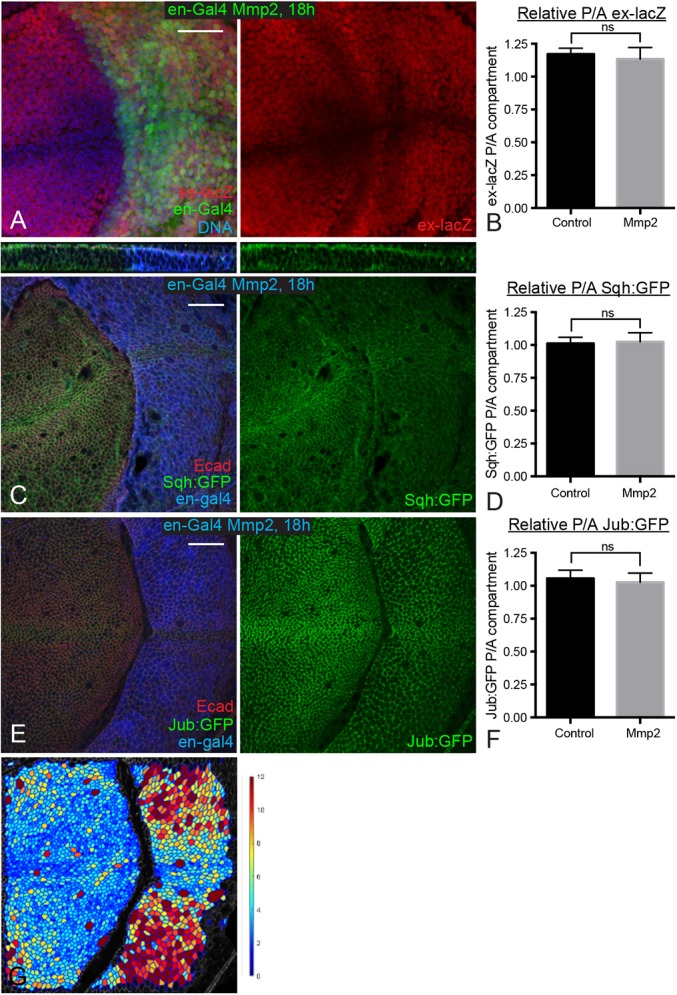
Degrading basement membrane does not increase cytoskeletal tension. (A) Wing disc expressing en-Gal4 UAS-GFP (green) UAS-Dcr2 tub-Gal80ts UAS-Mmp2 ex-lacZ stained for ex-lacZ (red) and DNA (blue). Larvae were cultured at 18°C, shifted to the restrictive temperature for Gal80ts (29°C) for 18 h before dissection. (C,E) Wing discs expressing en-Gal4 UAS-dcr2 tub-Gal80ts UAS-Mmp2 and Sqh:GFP (C) or Jub:GFP (E) were stained for Dcr2 (blue) and E-cad (red). Larvae were cultured at 18°C, shifted to the restrictive temperature for Gal80ts (29°C) for 18 h before dissection. The top panel in C shows a z section through the disc. (B,D,F) Histograms showing relative posterior to anterior (P/A) ex-lacZ (B), Sqh:GFP (D) and Jub:GFP (F) intensity for wing discs of the indicated genotypes, normalized to DNA (B) or E-cad (D,F). n=12 for all experiments. Error bars indicate 95% confidence interval. (G) A cell area color map of the disc shown in panel E shows quantitation of cell area, blue to violet, 0 µm2 to 12 µm2. ns, P>0.05. Scale bars: 20 µm.
