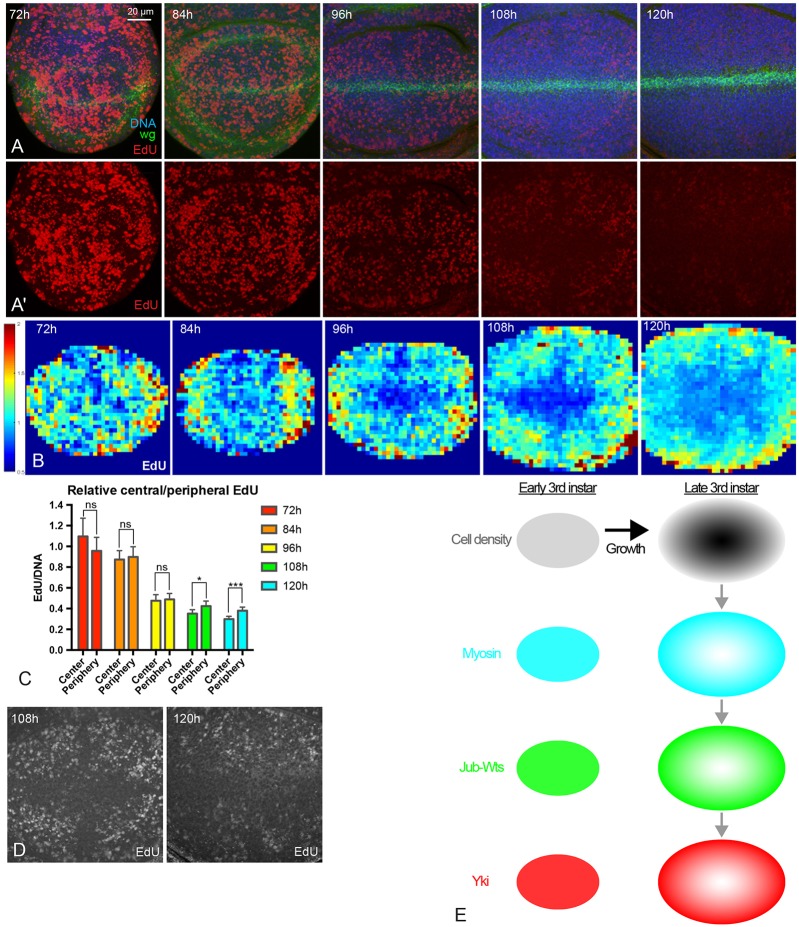
Fig. 7.
Patterns of cell proliferation during wing disc development. (A,A′) Wing discs at 72 h, 84 h, 96 h, 108 h and 120 h AEL stained for DNA (blue), Wg (green) and EdU (red). Pictures were taken under the same conditions. A′ shows only the EdU stain from the images in A. (B) Heat maps of relative EdU intensity of wing discs from 72 h to 120 h AEL (red, high; blue, low). Number of wing discs used for analysis: 72 h, n=5; 84 h, n=6; 96 h, n=5; 108 h, n=5; 120 h, n=5. (C) Histogram showing relative EdU intensity in the central and peripheral regions of wing discs at different stages. n=12 to 15 discs/timepoint. Error bars indicate 95% confidence interval. ns, P>0.05; *P<0.05; ***P<0.001. (D) Images with enhanced brightness to illustrate the spatial pattern of EdU (white) at 108 h and 120 h AEL. (E) Summary model of results. Growth of the wing disc leads to higher cell density in the center of the wing pouch (dark gray). Higher cell density reduces myosin levels and cytoskeletal tension, which reduces formation of Jub-Wts complexes at junctions, which reduces activity of Yki by decreasing inhibition of Wts by Jub. This results in lower Yki activity in the center of the wing pouch, except along compartment boundaries (not shown). Scale bar: 20 µm.

