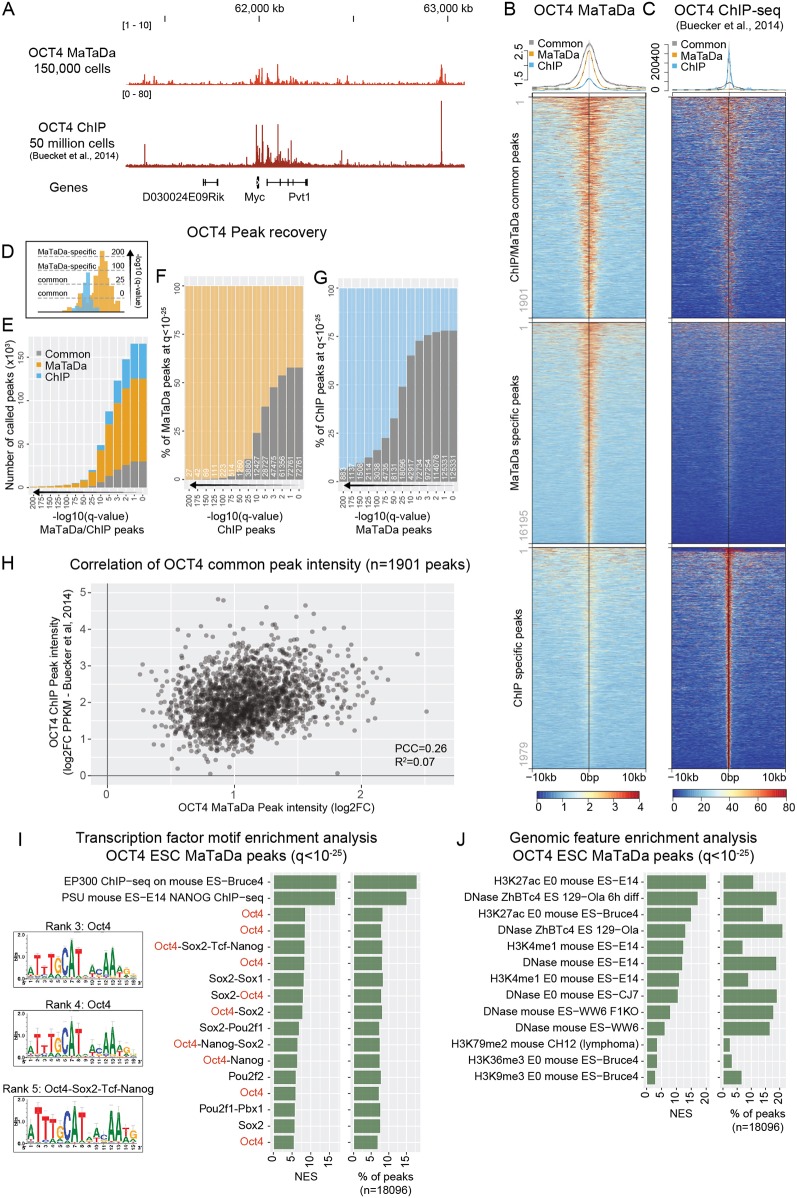
Fig. 2.
MaTaDa accurately profiles genome-wide transcription-factor occupancy. (A) Genome browser view of OCT4 binding at the Myc locus (MaTaDa; average of three replicates) compared with ChIP. MaTaDa data are represented as fold enrichment of Dam-fusion over Dam-only; ChIP-seq data are represented as aligned reads. (B,C) OCT4 MaTaDa (B) and ChIP-seq (C) ESC signal is plotted over a 10 kb window either side of the peak midpoint, for peaks common to MaTaDa and ChIP-seq (top), specific to MaTaDa only (middle) and specific to ChIP-seq only (bottom) at q<10−25. Above are metaplots of the MaTaDa (B) and ChIP-seq (C) signal. (D) Schematic to illustrate how peak recovery between two different datasets can vary depending on the q-value. (E-G) Number (E) or percentage (F,G) of peaks called upon changing the q-value for peak detection, either for MaTaDa and ChIP-seq in parallel (E), or compared with a fixed q-value <10−25 for MaTaDa (F) or ChIP-seq (G). Common peaks are grey, MaTaDa-specific peaks are orange, ChIP-seq-specific peaks are blue. (H) Scatterplot of peak intensity for peaks (q<10−25) common to OCT4 MaTaDa and ChIP-seq. PCC, Pearson correlation coefficient. (I,J) Transcription factor motif (I) and genomic feature (J) enrichment analysis of OCT4 MaTaDa peaks (q<10−25, 18,096 peaks). Position weight matrices (PWM) are shown for the top three enriched motifs for which a PWM was available. Normalised enrichment score (NES) and percentage of peaks containing the feature are indicated.

