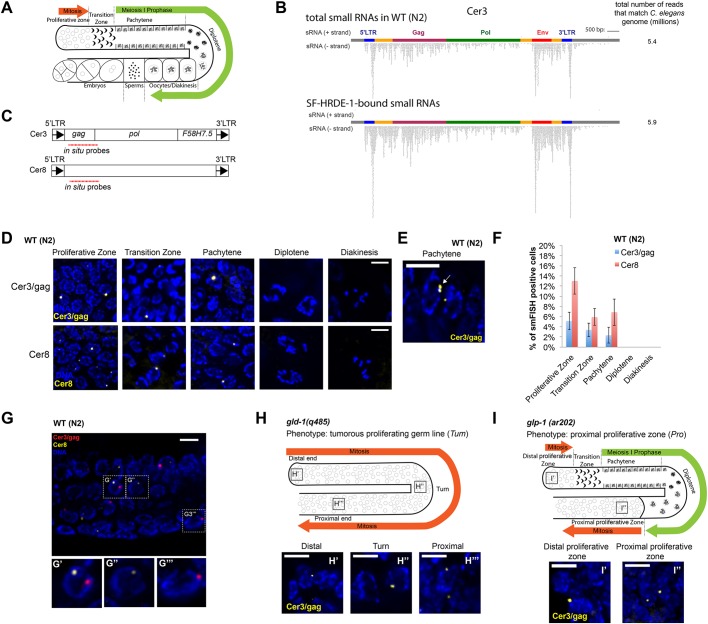
Fig. 1.
smFISH analysis of Cer3 and Cer8 RNA transcripts in WT adult germline. (A) Schematic of the gonad in C. elegans hermaphrodite adult. (B) Total siRNAs and HRDE-1-co-IP siRNAs at Cer3. Each dot represents a sequenced siRNA. Sense and antisense siRNAs were plotted separately as indicated. 5′- and 3′-LTR siRNAs cannot be distinguished due to the identical DNA sequences of the two LTRs. (C) Design of Cer3/gag and Cer8 smFISH probe sets. (D) Cer3/gag and Cer8 smFISH signals at different stages of adult germ cells. Wild-type (N2) hermaphrodite animals (23°C) were used (also for panels E-G). (E) An example of a pair of adjacent Cer3/gag smFISH dots (white arrow) in a pachytene nucleus. (F) Percentage of Cer3/gag or Cer8 smFISH-positive nuclei observed at different developmental stages of adult germ cells. Five biological replicates. Mean±s.d. is plotted. (G-G‴) Two-color smFISH analysis of Cer3/gag and Cer8 at the pachytene stage. G′-G‴ show magnifications of the boxed areas in G. (H-H‴) Schematic of the gld-1(q485) tumorous germline phenotype (H) and Cer3/gag smFISH in different regions of the gld-1(q485) gonad (H′-H‴). (I-I″) Schematic of the glp-1(ar202) proximal proliferative zone (I) and Cer3/gag smFISH in different regions of glp-1(ar202) gonad (25°C) (I′,I″). See Fig. S4 for smFISH profiles of the entire gonads. Scale bars: 5 μm.

