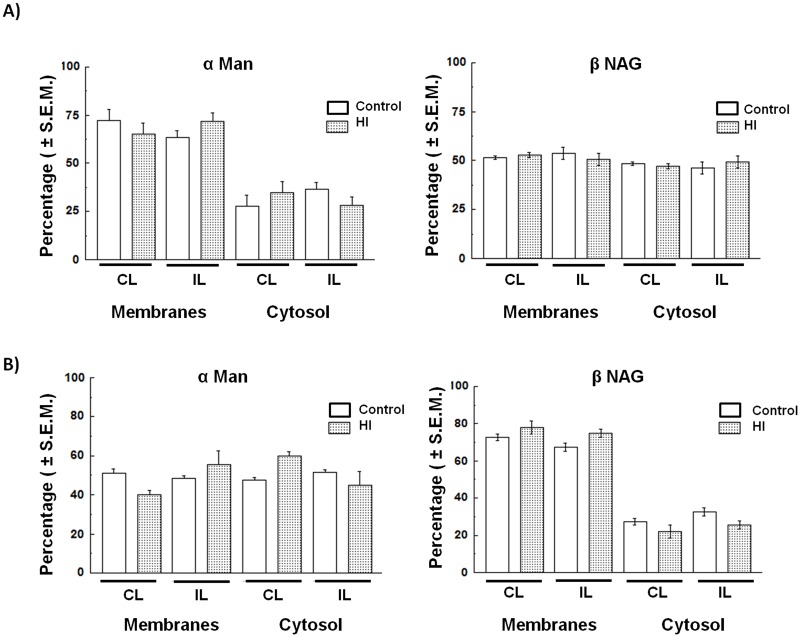
Fig. 8.
Distribution of αMan and βNAG enzyme activity. (A) In the cerebral cortex (Cx) and (B) in the hippocampus (HIP). Values are expressed as percentage (mean) of specific enzymatic activity (U/mg protein)±s.e.m. from three independent experiments. IL, ipsilateral; CL, contralateral brain hemisphere; αMan, α-mannosidase; βNAG, N-acetyl β-D-glucosaminidase.

