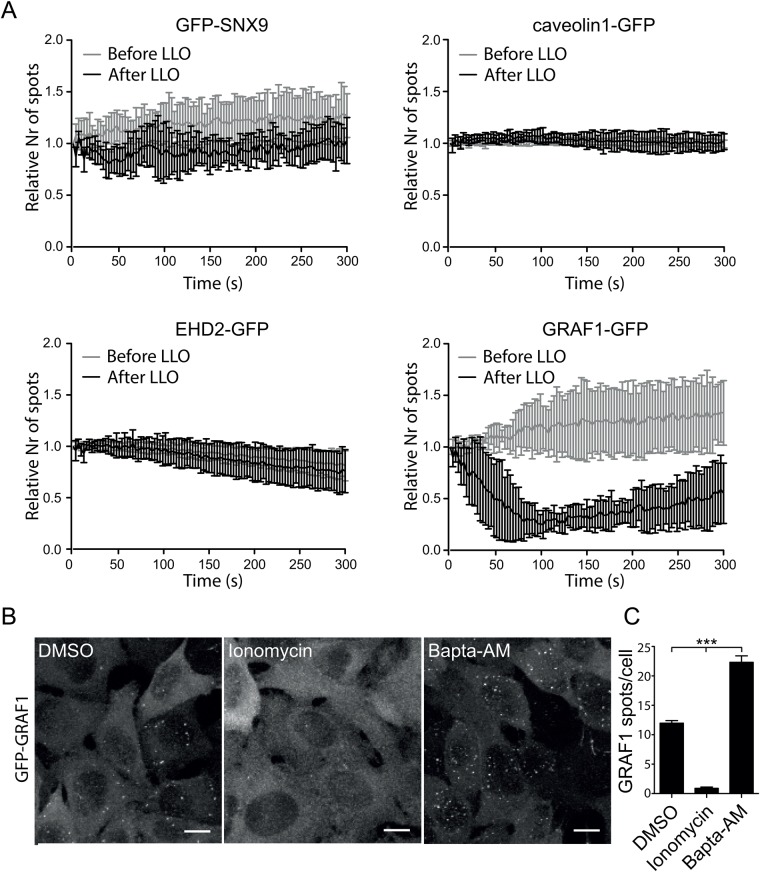
Fig. 5.
Pore formation by LLO represses GRAF1 assembly but does not influence the number of caveolin1- or SNX9-positive structures. (A) Graphs showing the number of endocytic spots detected by live-cell TIRF microscopy of HeLa Flp-In TRex cells expressing different endocytic proteins treated with LLO. The number of endocytic structures present in the TIRF field was quantified every 3 s for 5 min before and after LLO addition and plotted as the relative number of spots where the first frame of respective movie was set as 1. Error bars represent the s.d. Only movies with cells showing ANXA6-mCherry recruitment to the plasma membrane after addition of LLO were quantified. Time 0 s represent the acquisition start time in all subfigures. The data represent quantifications derived from several cells and independent movies from three independent experiments n=3 except for GRAF1, where n=1 on 7 cells. (B) Representative micrographs of maximum-projected confocal z-stacks showing fixed Flp-In TRex cells expressing GFP-GRAF1. Vehicle DMSO (control), 10 μM Ionomycin and 50 μM Bapta-AM was added to the cells for 30 min followed fixation and imaging, respectively, as indicated. Scale bars 10 μm. (C) Bar plot of the number of GFP-GRAF1 structures quantified after 30 min of drug treatment. P-values from one-way ANOVA: control versus Ionomycin P<0.01, control vs Bapta AM P<0.0001, Ionomycin vs Bapta AM P<0.0001. n=3. Error bars represent s.d.

