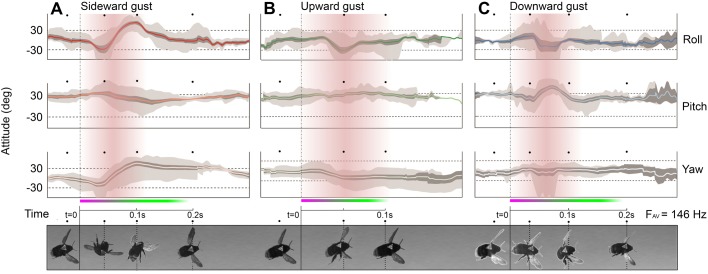
Fig. 2.
Bumblebee flight attitudes. Mean attitude maneuvers of bees flying through (A) sideward gusts, (B) upward gusts and (C) downward gusts. Data are plotted against absolute time referenced to the time instance at which bees first enter the gust on the time axis. Gusts are illustrated in red where fading color represents the time at which bees were less likely to be within the gust. Dark shading represents the standard error of the mean attitude. Light shading shows the maximum and minimum angular displacements recorded. Response phases are shown in a purple (impulsive) zone and a green (recovery) zone. Corresponding image snapshots of bees during major maneuvers are represented sequentially below each set of plots (D).

