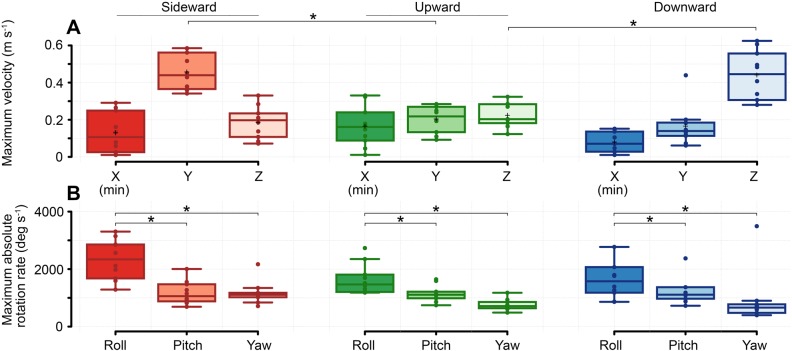
Fig. 4.
Flight velocities. Box plots of (A) maximum translation rates and (B) maximum rotation rates in three gust directions. Note that box plots for X velocity show minimum values. All other plots are maximum values which were taken after applying filters to reduce error arising from the numerically differentiated data (see Fig. S1). Significance is determined by using paired t-tests (n=10) for all sets.

