Fig. 9.
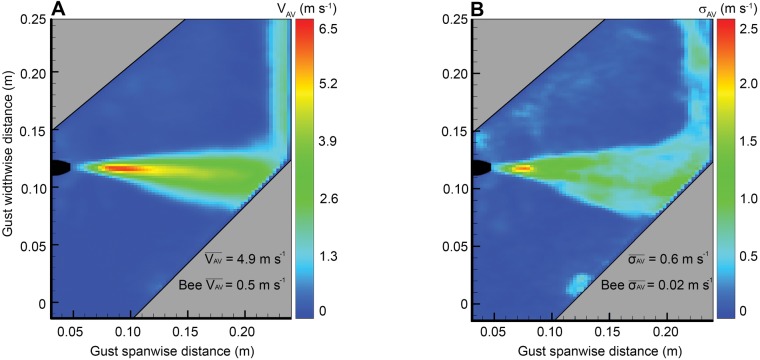
Gust details. Digital quantification of the gust showing (A) average gust velocity calculated from 300 samples captured in one second and (B) standard deviation of the gust velocity. The 2D images shown here resemble a plane orthogonal to the gust plane depicted in Fig. 1. To capture the gust in its actual position of operation (in the flight tunnel), a laser sheet was projected diagonally into the cross-sectional field of interest in the gust midpoint. Hence, resultant images are cropped in a slanted format to capture the structure of the gust. Grey shaded zones are the regions which were not illuminated by the diagonally slanted laser sheet and contain no useful data. The color bar label for the left image, VAV, is defined as the average velocity magnitude for each pixel sampled over 300 images corresponding to a gust duration of 1 s. The color bar label for the right image, σAV, is defined as the standard deviation of average velocity magnitudes for the same sample of 300 images (Table 1). In Panel A,  represents the average gust velocity within the regions of the jet depicted in the image. Bee
  is shown below this for comparison and represents the average forward velocity of bee in steady flight just before meeting the gust (gust entry velocity). In Panel B,
  represents the mean of all standard deviations of average gust velocity within the gust flow depicted in the contour image. Bee
  is shown to provide an idea of how bee mean velocity changes during steady flight.

