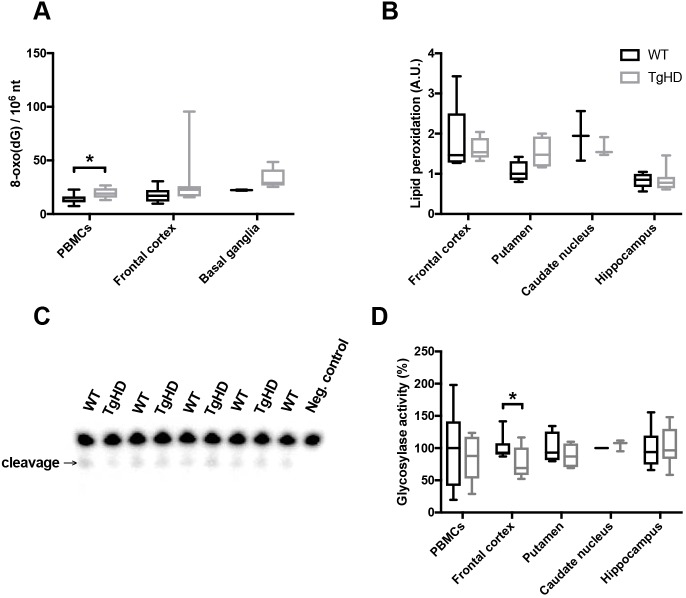
Fig. 3.
Tissue-specific alterations in oxidative DNA damage and repair in TgHD minipigs. (A) Mass spectrometry analysis of the oxidative damage marker 8-oxoG [as nucleoside 8-oxo(dG)] showed increased levels of PBMCs in TgHD relative to WT (P=0.03), whereas the frontal cortex and basal ganglia displayed similar levels in the two genotypes. (B) The level of malondialdehyde (MDA) was determined in the specified brain subregions. No significant differences were found between WT and TgHD in any of the groups. Arbitrary units (A.U.) represent levels of MDA (μg), showing the extent of lipid peroxidation. (C) Representative image of the DNA glycosylase activity assay, showing incision of 8-oxoG containing 32P-endlabeled oligonucleotide. Extracts were collected from individual animals. (D) DNA glycosylase activity toward 8-oxoG in nuclear protein extracts from PBMCs and different brain subregions. The analysis of substrate cleavage by DNA glycosylase enzyme OGG1 revealed reduced activity in the frontal cortex in TgHD (P=0.03), and indicates a defect in DNA repair of oxidative DNA damage. No genotype differences were seen in other brain regions. Data are presented as relative to the average of the WT activities. Student's t-test, *P<0.05. Box plots and whiskers indicate minimum to maximum values, with hinges representing the 25th and 75th percentiles and the median indicated by the centerline. Samples sizes: (A) PBMCs, WT n=10, TgHD n=6; frontal cortex, WT n=10, TgHD n=7; basal ganglia, WT n=2, TgHD n=5; (B) frontal cortex, WT n=9, TgHD n=9; putamen, WT n=4, TgHD n=4; caudate nucleus, WT n=2, TgHD n=3; hippocampus, WT n=7, TgHD n=7; (D) PBMCs, WT n=7, TgHD n=8; frontal cortex, WT n=9, TgHD n=10; putamen, WT n=4, TgHD n=4; caudate nucleus, WT n=2, TgHD n=3; hippocampus, WT n=7, TgHD n=8.

