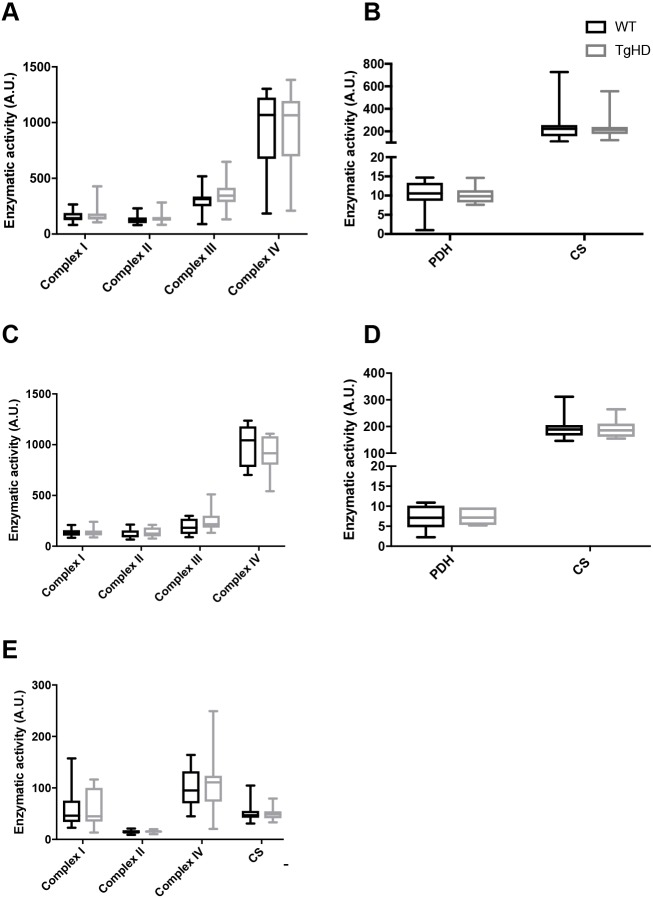
Fig. 4.
Mitochondrial status in TgHD minipig brain subregions and PBMCs. (A,B) Mitochondrial ETC complexes I-IV (A), pyruvate dehydrogenase (PDH) and citrate synthase (CS) (B) all showed normal activity in TgHD compared with WT in the frontal cortex. (C,D) In the basal ganglia, mitochondrial ETC complexes I-IV (C), PDH and CS (D) all showed normal activity in TgHD compared with WT. (E) In addition, mitochondrial ETC complexes I, II and IV and CS showed normal activity in TgHD compared with WT in PBMCs. Arbitrary units (A.U.) represent enzymatic activity in nmol/min/mg. Student's t-test was used to assess significance. Box plots and whiskers indicate minimum to maximum values, with hinges representing the 25th and 75th percentiles and the median indicated by the centerline. Sample sizes: (A,B) frontal cortex: complex I, WT n=19, TgHD n=20; complex II, III and IV, all WT n=19, TgHD n=21; PDH, WT n=16, TgHD n=17; CS, WT n=19, TgHD n=21; (C,D) basal ganglia: complex I-IV, all WT n=10, TgHD n=9; PDH, WT n=9, TgHD n=7; CS, WT n=10, TgHD n=9; (E) PBMCs: complex I, II and IV and CS, all WT n=18, TgHD n=19.

