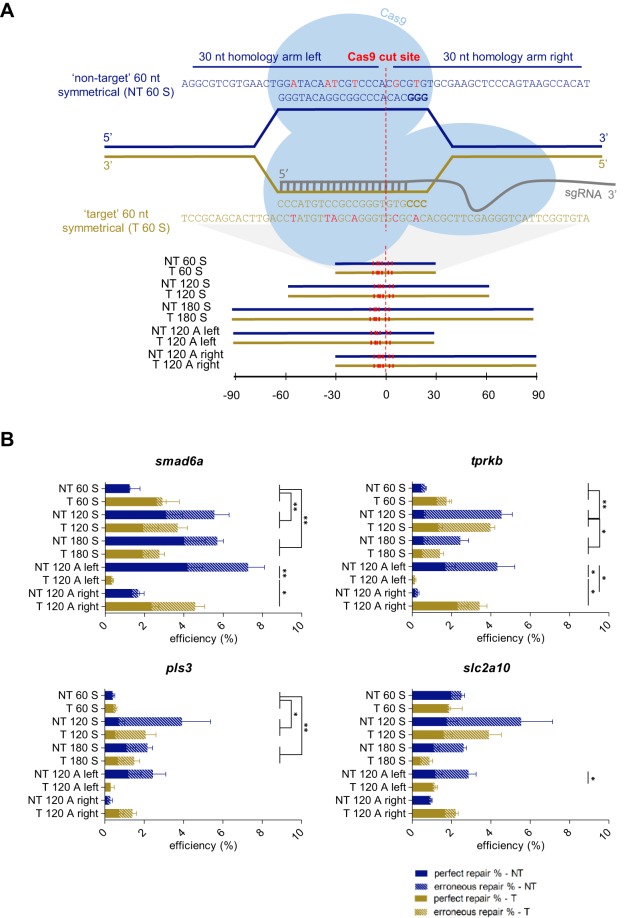
Fig. 1.
Impact of repair-template homology-arm length, strand complementarity and symmetry on HDR efficiency. (A) Illustration of an sgRNA target site for the zebrafish smad6a gene, with protospacer sequence GGGTACAGGCGGCCCACAC. Following Cas9 recruitment and sgRNA binding, the DNA is cleaved 3 bp upstream of the PAM sequence (NGG, displayed in bold), which is visualized by the dashed red line and indicated as the ‘Cas9 cut site’. We designed ten repair templates, 60, 120 or 180 nucleotides (nt) in length, either corresponding to the sgRNA target strand (‘target’ – T) or to the complementary strand (‘non-target’ – NT). The repair templates were either symmetrically (S) or asymmetrically (A) positioned around the Cas9 cut site. The position of the different repair templates relative to the Cas9 cut site is depicted in the lower panel. The sequence of the 60 nt repair templates for smad6a is shown in the upper panel, and the nucleotide sequences of all other repair templates are listed in Table S8. Each repair template contains several synonymous nucleotide changes, depicted in red, relative to the reference sequence, including replacement of a guanine nucleotide in the PAM, whenever possible. (B) For each target site (smad6a, tprkb, pls3 or slc2a10) and each repair-template type (NT 60 S, NT 120 S, NT 180 S, NT 120 A left, NT 120 A right, T 60 S, T 120 S, T 180 S, T 120 A left, T 120 A right), average total HDR efficiencies resulting from five independent experiments were plotted. Calculated repair rates represent the number of sequencing reads containing the intended base-pair substitution closest to the Cas9 cut site. The HDR rates were split up into two categories: ‘perfect repair %’, representing the percentage of NGS reads containing at least the base-pair change closest to the Cas9 cut site (plain bars), and ‘erroneous repair %’, representing the reads containing erroneous integration events of repair-template fragments (dashed bars). NT, non-target; T, target; 60-120-180, total repair-template length; S, symmetrical; A, asymmetrical. Error bars represent the s.e.m. for five independent biological replicates each consisting of a pooled sample of 20 embryos. Repair rates depicted in this graph are listed in Table S1. Statistical tests performed: one-way ANOVA with blocking (60 nt vs 120 nt, 60 nt vs 180 nt, 120 nt vs 180 nt, target vs non-target) for symmetrical templates, non-parametric Kruskal–Wallis test, followed by pairwise comparison with Dunn–Bonferroni correction, for asymmetrical templates; *P<0.05 and **P<0.01.

