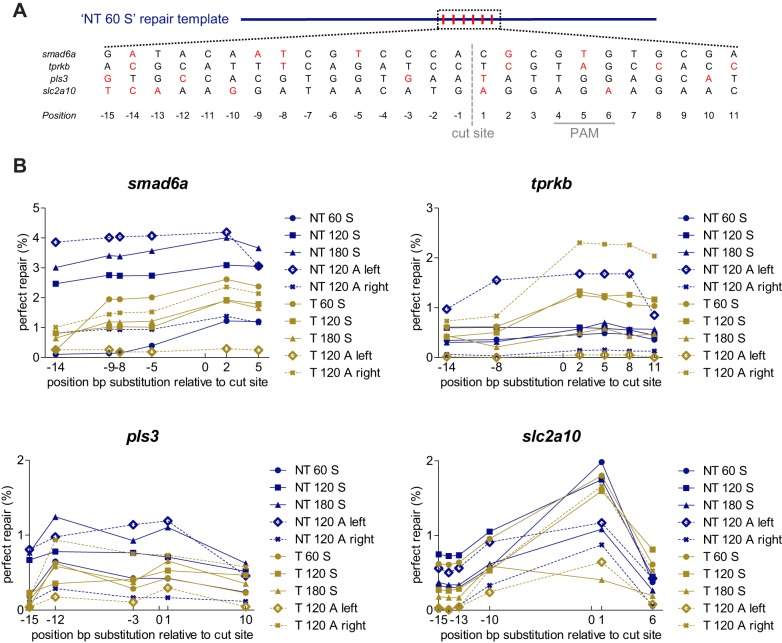
Fig. 3.
Impact of the position of the substituted nucleotide in the repair template on repair rates. (A) Repair-template composition with specified locations of the base pair alterations, shown for an ‘NT 60 S’ repair template. Each repair template included in this study contains several synonymous nucleotide changes relative to the reference sequence. Whenever possible, a guanine nucleotide of the PAM was replaced, in order to avoid undesired cleavage of the repair template by Cas9. In addition, five nucleotide changes were included in the region surrounding the Cas9 cut site (designated as point zero, visualized with a gray dashed line). All nucleotide changes are depicted in red. The position of the PAM sequence is marked with a full gray line. (B) The HDR efficiency (perfect repair only) for each base-pair substitution in each repair template is plotted as a function of the relative distance to the Cas9 cut site. Each plotted data point shows average values of five independent experiments, each analyzing 20 embryos. To improve clarity, error bars were omitted. NT, non-target; T, target; 60-120-180, total repair-template length; S, symmetrical; A, asymmetrical. Repair rates depicted in this graph are listed in Table S3.

