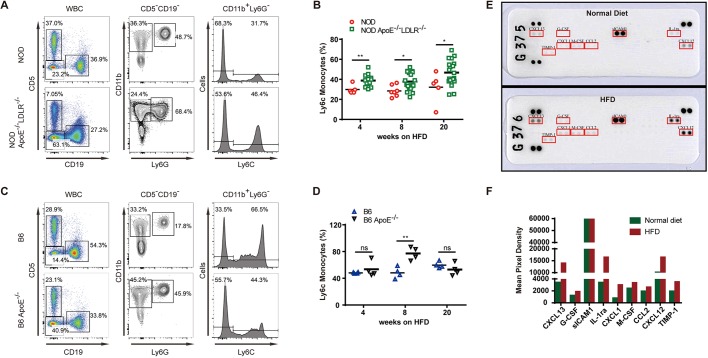
Fig. 5.
Immune response of NOD Apoe−/−Ldlr−/− mice to hyperlipidemia. (A) The gating for Ly6C-positive monocytes in the splenocytes of NOD Apoe−/−Ldlr−/− mice, with NOD as control (n=5-20). (B) Frequency of Ly6C-positive monocytes in NOD and NOD Apoe−/−Ldlr−/− mice. (C) The gating for Ly6C-positive monocytes in the splenocytes of B6 Apoe−/− and B6 control (n=4). (D) Frequency of Ly6C-positive monocytes in B6 and B6 Apoe−/− mice. (E) Serum cytokines in NOD Apoe−/−Ldlr−/− mice fed a HFD or normal diet for 20 weeks. Serum samples (100 μl) were collected from three mice from each group and analyzed by the Proteome Profiler Mouse Cytokine Array Kit. Data shown are from a 5-min exposure. (F) Quantification of the cytokine expression in samples used in E. Statistics by two-tailed, unpaired Student's t-test: *P<0.05, **P<0.01, ns, not significant.

