Fig. 7.
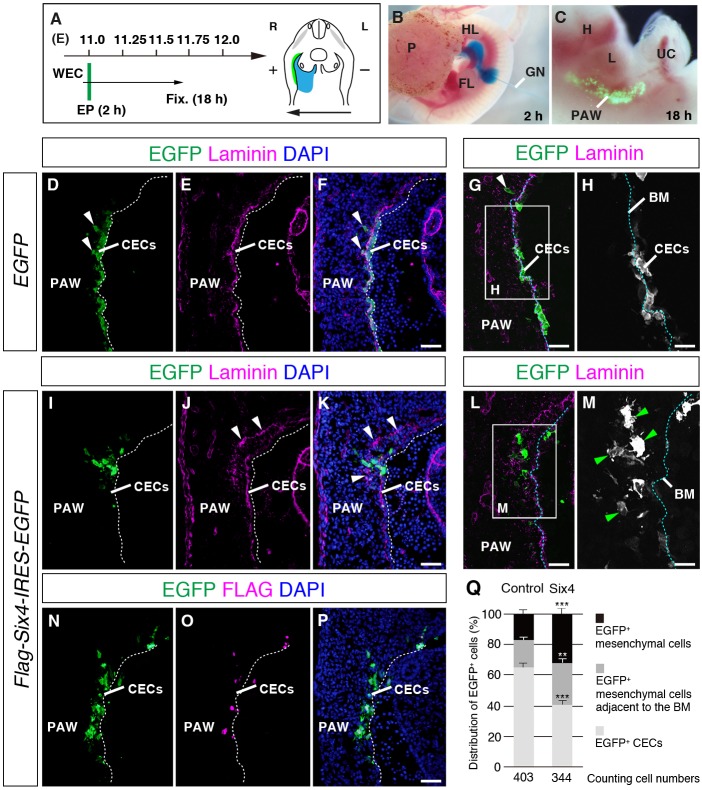
Distribution of EGFP-labeled cells after Six4 overexpression in abdominal CECs. (A-C) Timescale (A) and method (B) for gene transfer into the PAW in cultured mouse embryos. DNA solution (blue) is injected into the coelomic cavity using a fine glass needle, followed by electroporation (B). EGFP expression in the PAW of the electroporated embryos is visualized at 16 h after electroporation (C). (D-H) Distribution of EGFP-positive cells in the PAW of wild-type embryos electroporated with EGFP expression plasmids. White dotted lines in D-F indicate the apical border of the CE. Most EGFP-positive cells are observed in the CE (D) and reside adjacent to the laminin-positive basement membrane (E,F). Confocal microscopy of the PAW in wild-type embryos electroporated with EGFP expression plasmids (G,H). The EGFP signal in the rectangle in G is shown in gray scale. Blue dotted lines in G, H indicate the boundary between the mesenchyme and the CE. Cells expressing EGFP in the mesenchyme region reside close to the boundary (G,H). A small number of EGFP-positive cells localizes in the mesenchymal region (arrowheads in D,F,G). (I-P) Distribution of EGFP-positive cells in the PAW of wild-type embryos electroporated with pCAGIG-flag-Six4 plasmids. Expression of exogenous SIX4 protein is detected using a Flag antibody (O). Laminin distribution is irregular in the region distant from the normal position of the boundary between the mesenchymal region and the CE (arrowheads in J,K). Confocal microscopy of the PAW of wild-type embryos electroporated with Six4 expression plasmids (L,M). The EGFP signal in the rectangle in L is shown in gray scale (M). Most of the cells with exogenous SIX4 protein are positioned in the mesenchymal region and show cell morphology with filopodia (green arrowheads in M). White dotted lines in I-K,N-P indicate the edge of the apical side of the CE. Blue dotted lines in L and M indicate the border between the mesenchyme and the CE. (Q) Quantification of distribution of EGFP-positive (EGFP+) cells electroporated with control and Six4-expression plasmids. A total of 403 and 344 cells are counted in control- and Six4-overexpressing samples, respectively. The percentages of distribution of EGFP+ cell types were indicated. Six4-overexpression in CECs decreases the ratio of EGFP+ cells in the CE and increases that of EGFP+ mesenchymal cells, compared to those in the control experiment. **P<0.01, ***P<0.001, Student's t-test, n=3. BM, basement membrane; FL, forelimb; GN, glass needle; H, heart; HL, hindlimb; L, liver; P, placenta, PAW, primary abdominal wall; UC, umbilical cord. Scale bars: 50 μm in D-G,I-L,N-P; 25 μm in H,M.

