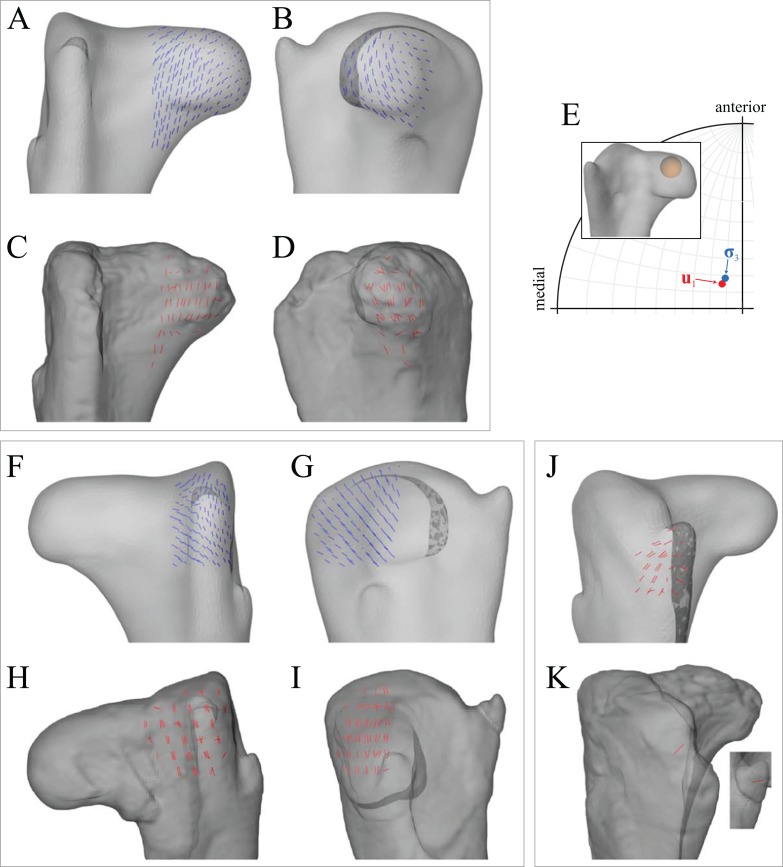
Figure 9. Principal stress trajectories for the proximal femur in the solution posture of ‘Troodon’, compared with observed cancellous bone fabric.
(A and B) Vector field of σ3 in the femoral head, shown as 3-D slices parallel to the coronal plane (A, in anterior view) and sagittal plane (B, in medial view). (C and D) Observed vector field of u1 in the femoral head, in the same views as (A) and (B), respectively (cf. Part I). (E) Comparison of the mean direction of σ3 in the femoral head (blue) and the mean direction of u1 (red), plotted on an equal-angle stereoplot with northern hemisphere projection. Inset shows location of region for which the mean direction of σ3 was calculated. (F and G) Vector field of σ3 under the greater trochanter, shown as 3-D slices parallel to the coronal plane (F, in posterior view) and sagittal plane (G, in lateral view). (H and I) Observed vector field of u1 under the greater trochanter, shown in the same views as (F and G), respectively (cf. Part I). (J) Vector field of σ1 in the lesser trochanter, shown in oblique anterolateral view. (K) Observed vector field of u1 in the lesser trochanter, shown in the same view as (J) for both specimens studied (cf. Part I).

