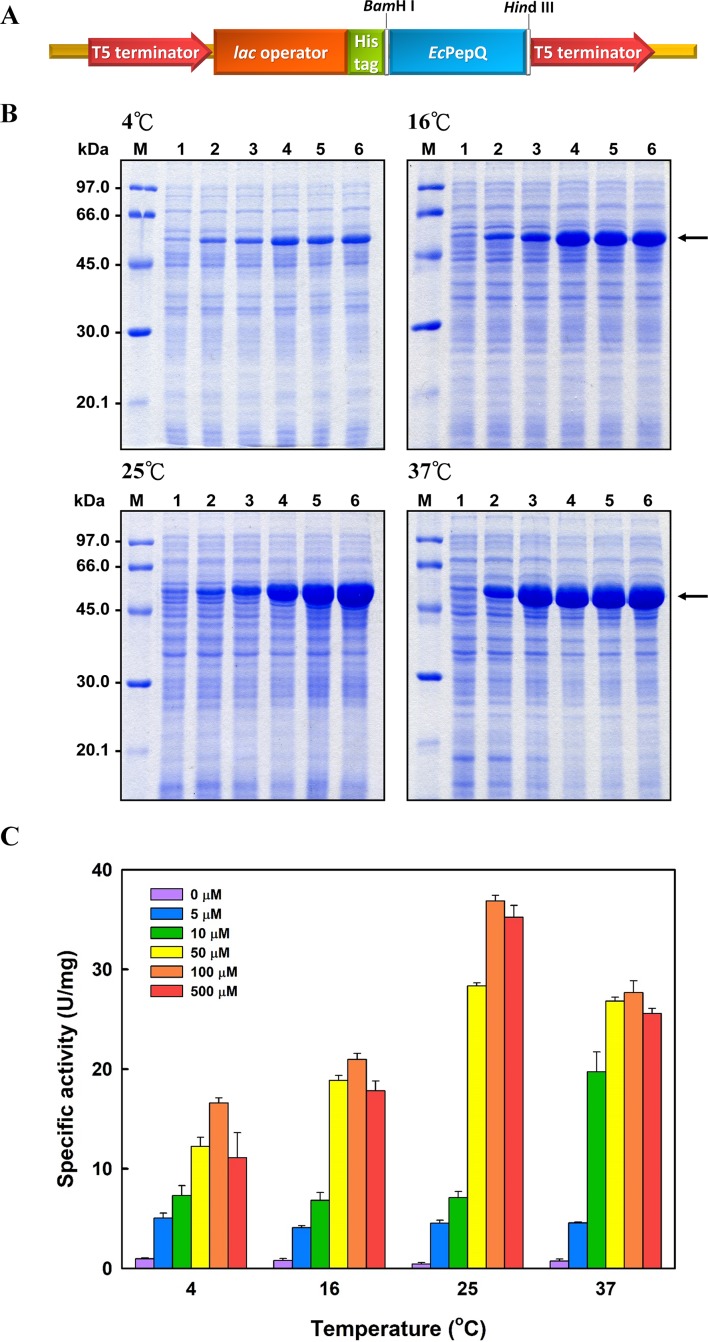
Figure 1. Analyses of the soluble proteins and specific activity of E. coli M15 (pQE-EcPepQ) under a specific condition.
(A) Schematic diagram of the key elements of pQE-EcPepQ. (B) Analysis of the crude extracts by SDS–PAGE. Lanes: M, protein size markers; 1, cell growth without IPTG induction; 2, cell growth with 5 μM IPTG induction; 3, cell growth with 10 μM IPTG induction; 4, cell growth with 50 μM IPTG induction; 5, cell growth with 100 μM IPTG induction; 6, cell growth with 500 μM IPTG induction. (C) Effects of incubation temperature and IPTG concentration on the production of active EcPepQ. The amount of active enzyme was determined by measuring the prolidase activity of the soluble extracts shown in (B). These data were a representative of three independent experiments.

