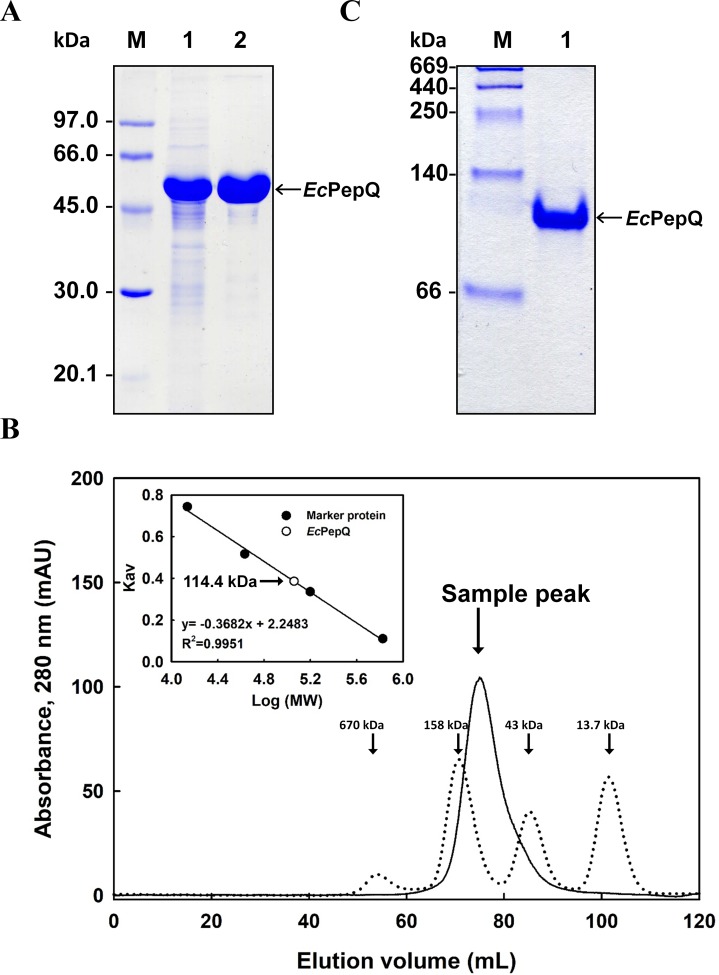
Figure 2. Gel electrophoresis and size-exclusion chromatography of the recombinant enzyme.
(A) SDS–PAGE analysis. Lanes: M, protein size markers; 1, the crude extract of E. coli M15 (pQE-EcPepQ); 2, the enzyme sample after Ni-NTA purification. (B) FPLC analysis. Blue dextran 2000 was used to determine the void volume. The Kav values for the standard proteins and EcPepQ were plotted against the logarithm of their molecular weights to estimate the native molecular mass of EcPepQ. (C) Native PAGE analysis. Lanes: M, protein size markers; 1, the enzyme sample after Ni-NTA purification.

